Development
Overview
This section of the book is about your local development environment and the tools that I find most efficient and effective.
Local Drupal site setup
Local development works really well using Docker containers and DDEV. Setting up a local site is a completely painless process on any operating system. After installing Docker and DDEV, follow these steps:
Install Drupal
Drupal 10
mkdir my-drupal10-site
cd my-drupal10-site
ddev config --project-type=drupal10 --docroot=web
ddev start
ddev composer create drupal/recommended-project:^10
# ddev config --update
ddev composer require drush/drush
ddev drush site:install --account-name=admin --account-pass=admin -y
# Display a one-time link (CTRL/CMD + Click) from the command below to log in and edit your admin account details.
ddev drush uli
## Or this will open a browser and you can log in with username: `admin` and password: `admin`
ddev launch
# Or automatically log in with
ddev launch $(ddev drush uli)
See DDEV docs
Drupal 11
mkdir my-drupal-site && cd my-drupal-site
ddev config --project-type=drupal11 --php-version=8.3 --docroot=web
ddev start
ddev composer create drupal/recommended-project:^11
ddev composer require drush/drush
ddev drush site:install --account-name=admin --account-pass=admin -y
# Display a one-time link (CTRL/CMD + Click) from the command below to log in and edit your admin account details.
ddev drush uli
## Or this will open a browser and you can log in with username: `admin` and password: `admin`
ddev launch
# Or automatically log in with
ddev launch $(ddev drush uli)
See DDEV docs
Note
The link that is returned by drush uli can quickly be launched with the keyboard shortcut ⌘ Cmd + Mouse Click.
More at DDEV CMS Quickstart guides: Drupal installation. And the Local development guide on drupal.org.
Install Devel module
To generate dummy content and access a host of other useful tools, install the Devel module
ddev composer require drupal/devel --dev
ddev drush en devel devel_generate -y
Read more about Devel generate
Install Drupal Core developer tools
To install the core dev tools, use the following command:
ddev composer require drupal/core-dev --devThe drupal/core-dev package includes various tools and libraries intended for development.
Using composer show drupal/core-dev --all you can see the contents of the package. It should generate something like:
behat/mink ^1.10
behat/mink-browserkit-driver ^2.1
behat/mink-selenium2-driver ^1.4
colinodell/psr-testlogger ^1.2
composer/composer ^2.7
drupal/coder ^8.3.10
instaclick/php-webdriver ^1.4.1
justinrainbow/json-schema ^5.2
mglaman/phpstan-drupal ^1.2.1
micheh/phpcs-gitlab ^1.1
mikey179/vfsstream ^1.6.11
open-telemetry/exporter-otlp ^1
open-telemetry/sdk ^1
php-http/guzzle7-adapter ^1.0
phpspec/prophecy-phpunit ^2
phpstan/extension-installer ^1.1
phpstan/phpstan ^1.10.47
phpstan/phpstan-phpunit ^1.3.11
phpunit/phpunit ^9.6.13
symfony/browser-kit ^6.4
symfony/css-selector ^6.4
symfony/dom-crawler ^6.4
symfony/error-handler ^6.4
symfony/lock ^6.4
symfony/phpunit-bridge ^6.4
symfony/var-dumper ^6.4
Note
The drupal/core-dev package is intended for development and should not be used in production. Remove it with ddev composer install --no-dev before deploying to production.
Install Admin Toolbar Module & Module Filter
Every site needs Admin toolbar module and Module filter module
ddev composer require drupal/admin_toolbar drupal/module_filter
ddev drush en admin_toolbar module_filter admin_toolbar_tools -y
Install drushonhost
I also like to immediately install the drushonhost addon:
ddev get rfay/ddev-drushonhostRead more about global drush and drushonhost
Edit the web/sites/default/settings.php so settings.local.php loads before settings.ddev.php (the order is critical). You will need to uncomment the lines that load the settings.local.php:
if (file_exists($app_root . '/' . $site_path . '/settings.local.php')) {
  include $app_root . '/' . $site_path . '/settings.local.php';
}

// Automatically generated include for settings managed by ddev.
$ddev_settings = dirname(__FILE__) . '/settings.ddev.php';
if (getenv('IS_DDEV_PROJECT') == 'true' && is_readable($ddev_settings)) {
  require $ddev_settings;
}
Set up settings.local.php
Copy the sites/example.settings.local.php to sites/default/settings.local.php with
cp web/sites/example.settings.local.php web/sites/default/settings.local.phpAdd the line below to include the IS_DDEV_PROJECT environment variable as the last line of your settings.local.php:
putenv("IS_DDEV_PROJECT=true");After a ddev drush cr and perhaps a ddev restart you should be able to run drush on the host. e.g. ddev drush cst.
If you see an error like: PHP Fatal error: Composer detected issues in your platform: Your Composer dependencies require a PHP version ">= 8.2.0". You are running 8.1.28. in /Users/selwyn/Sites/ddev104/vendor/composer/platform_check.php on line 24, this means your project might be using PHP 8.3 while you have PHP 8.1 installed on your Mac globally. You can downgrade the PHP version in the project config.yaml or update your host (macOS) PHP version with brew install php@8.3 and then brew link --force --overwrite php@8.3 to make it the default PHP version. You can check the version with php -v.
Set config sync directory
Make the config sync dir off the root of the project (i.e. at the same level as the web directory:
mkdir -p config/syncAnd add it to your sites/default/settings.php. Here is the section in that file:
/**
 * Location of the site configuration files.
 *
 * The $settings['config_sync_directory'] specifies the location of file system
 * directory used for syncing configuration data. On install, the directory is
 * created. This is used for configuration imports.
 *
 * The default location for this directory is inside a randomly-named
 * directory in the public files path. The setting below allows you to set
 * its location.
 */
# $settings['config_sync_directory'] = '/directory/outside/webroot';
$settings['config_sync_directory'] = '../config/sync';
Some optional steps
Make a local backup of your database with:
ddev export-db -f dbdump1.sql.gzExport your config with:
ddev drush cexAdd a .gitignore file in the project root. Here are some common entries:
/vendor/
/web/core/
/web/modules/contrib/
/web/themes/contrib/
/web/profiles/contrib/
/web/libraries/
/web/sites/development.services.yml
/web/sites/example.settings.local.php
/web/sites/example.sites.php
/web/sites/default/default.services.yml
/web/sites/default/default.settings.php

# Ignore default README files
/web/README.txt
/web/README.md
/web/modules/README.txt
/web/profiles/README.txt
/web/sites/README.txt
/web/themes/README.txt

# Ignore paths that contain user-generated content.
/web/sites/*/files
/web/sites/*/private

# local settings file
/web/sites/*/settings.local.php
Add a README.md in the root of your project with a description of your project.
Create your repo on GitHub (or GitLab) and add your site to git with:
git init
git add .
git commit -m "first commit"
git branch -M main
# Use your own repo here
git remote add origin git@github.com:hotshotcoderdude/ddev102.git
git push -u origin main
Rock n Roll!!!
Drupal Starter Project
I have created the drupalstarter project on github which has already completed these steps, so you can clone that and start from there.
git clone git@github.com:selwynpolit/drupalstarter.git my-drupal-site
cd my-drupal-site
ddev start
ddev drush site:install --account-name=admin --account-pass=admin -y
# setup settings.local.php as above
# setup your config sync directory
ddev cim -y
Checking Your Permissions
During the wizard installation, or when your welcome page first loads, you might see a warning about the permissions settings on your /sites/web/default directory and one file inside that directory: settings.php.
After the installation script runs, Drupal will try to set the web/sites/default directory permissions to read and execute for all groups: this is a 555 permissions setting. It will also attempt to set permissions for default/settings.php to read-only, or 444. If you encounter this warning, run these two chmod commands from your project's root directory. Failure to do so poses a security risk:
chmod 555 web/sites/defaultchmod 444 web/sites/default/settings.phpTo verify that you have the correct permissions, run this ls command with the a, l, h, and d switches and check that your permissions match the following output:
$ ls -alhd web/sites/default web/sites/default/settings.php

dr-xr-xr-x 8 sammy staff 256 Jul 21 12:56 web/sites/default
-r--r--r-- 1 sammy staff 249 Jul 21 12:12 web/sites/default/settings.php
You are now ready to develop a Drupal website on your local machine.
Converting existing site (non-composer-based) to use composer
Here are some resources if you find yourself in this unfortunate situation: Taking an existing Drupal application that is not managed with Composer and beginning to manage it with Composer can be a little tricky. Check out this tutorial on how to use Composer with Your Drupal Project from Drupalize.me - Updated August 2023. Also, this Composerize Drupal github repo - June 2022 may be useful.
DDEV
For local Docker container development on any platform, there is no better tool than DDEV. This is a well-documented, well-supported tool cared for Randy Fay and the DDEV community. You can get help from him or some of the other friendly folks on Discord almost instantly.
From the docs:
Lots of built-in help: ddev help and ddev help <command>. You'll find examples and explanations.
DDEV Stack Overflow for support and frequently asked questions. We respond quite quickly here and the results provide quite a library of user-curated solutions.
DDEV issue queue for bugs and feature requests
Interactive community support on Discord for everybody, plus sub-channels for CMS-specific questions and answers.
awesome-ddev repo has loads of external resources, blog posts, recipes, screencasts, and the like. Your contributions are welcome.
Local config - your .ddev/config.local.yaml
From https://ddev.readthedocs.io/en/stable/users/extend/config_yaml
You can override the config.yaml with extra files named
config.*.yaml\. For example, use.ddev/config.local.yamlfor configuration that is specific to one environment, and that is not intended to be checked into the team's defaultconfig.yaml.Additionally, you could add a
.ddev/config.local.ymlor.ddev/config.selwyn.yamlfor your own values.- Here you can specify the project name so you can have a unique name for each instance of the project. The checked-in version of the config.yml could be set to name:
agovand then each version (e.g.agov1,agov2,agov3) could be set in theconfig.selwyn.yamlfile. - I like to set the timezone and the router port in case some of my coworkers use different values:
- Here you can specify the project name so you can have a unique name for each instance of the project. The checked-in version of the config.yml could be set to name:
name: agov1
router_http_port: "80"
router_https_port: "443"
timezone: America/Chicago
Use ddev start (or ddev restart) after making changes to get the changes to take effect.
In the endless quest for speed in local development, DDEV uses Mutagen on Mac OS. Apparently, the WSL2 setup on Windows 10/11 is the fastest performer for DDEV at the time of this writing.
Fish shell in DDEV containers
This is a real productivity enhancement. When you use ddev ssh you get the old boring bash shell. For a cooler more whizbang fish shell, which will delight you with features like tab completions and syntax highlighting that just work, with nothing new to learn or configure, use the following:
In your .ddev/config.yaml add the following line:
webimage_extra_packages: [fish]In your .ddev/homeadditions/.profile add this:
# if running bash
if [ -n "$BASH_VERSION" ]; then
    # include .bashrc if it exists
    if [ -f "$HOME/.bashrc" ]; then
	. "$HOME/.bashrc"
    fi
fi

# set PATH so it includes user's private bin if it exists
if [ -d "$HOME/bin" ] ; then
    PATH="$HOME/bin:$PATH"
fi
fish
Now, ddev ssh will load fish automagically
ddev ssh
Welcome to fish, the friendly interactive shell
Type `help` for instructions on how to use fish
spolit@ddev101-web /v/w/html (main)>
If you don't see fish loading, you can confirm that the .profile file successfully made it to the containers by ssh'ing into the container and cat'ing and file'ing the file. file should return ASCII text and cat should display clear text with no strange codes. See below for details. If you don't see clear text, try using a different editor to recreate the file:
ddev ssh
spolit@tea-web:/var/www/html$ cat ~/.profile
# ~/.profile: executed by the command interpreter for login shells.
# This file is not read by bash(1), if ~/.bash_profile or ~/.bash_login
# exists.
# see /usr/share/doc/bash/examples/startup-files for examples.
# the files are located in the bash-doc package.

# The default umask is set in /etc/profile; for setting the umask
# for ssh logins, install and configure the libpam-umask package.
#umask 022

# if running bash
if [ -n "$BASH_VERSION" ]; then
    # include .bashrc if it exists
    if [ -f "$HOME/.bashrc" ]; then
	. "$HOME/.bashrc"
    fi
fi

# set PATH so it includes user's private bin if it exists
if [ -d "$HOME/bin" ] ; then
    PATH="$HOME/bin:$PATH"
fi


spolit@tea-web:/var/www/html$ file ~/.profile
/home/spolit/.profile: ASCII text
Note
You can also create a global .profile file to run in all containers at ~/.ddev/homeadditions. This doesn't apply to loading fish in all containers as there is not currently a facility to handle global webimage_extra_packages.
setup aliases in ddev
I love short Linux aliases like ll (or just l) for listing files. If you spend time poking around the file system in your containers this makes life so much better. A cool new feature since Ddev v15.1 lets you add aliases using this technique
Use ddev ssh to "ssh" into the container and then type ll to list the files in a directory.
Either copy .ddev/homeadditions/bash_aliases.example to .ddev/homeadditions/.bash_aliases and add them there! Don't forget the leading period in the filename.
OR
Create a file .ddev/homeadditions/.bash_aliases with these contents: note, those are the letter L lower case (as in lima).
alias ll="ls -lhAp"
alias l="ls -lhAp"
Note, be sure to restart the container with ddev restart to see the changes. Don't use .homeadditions - use the homeadditions with no period (or full stop) in front.
Post start or post import hooks
You can run a script after the container starts or after the database is imported. This is useful for doing some last-minute setup or creating required directories etc. For example, you can run a script to enable modules, set up configuration, or run drush commands.
Here are some examples that you can add to your .ddev/config.yaml file:
# 6-11-24: Node ver 16, import docksal config split, add packages.
hooks:
  post-start:
    - exec: drush config-split:import docksal -y
#    - exec: cd /var/www/html/web/themes/custom/uddd && npm install
  post-import-db:
    - exec: drush config-split:import docksal -y
or
# Create local private files dir.
hooks:
  post-start:
    - exec: mkdir -p /var/www/html/docroot/sites/default/files/private
Upgrading DDEV
After you install a new version of ddev, run ddev stop and then ddev config to reconfigure things for your project. Just press enter for all the questions. It keeps things rolling smoothly. Run ddev start to start it all back up again.
brew upgrade ddevNgrok Site sharing
This clever tool allows you to share your local site with others. You can use it to show off your work or get help from a colleague. Check out sharing your DDEV-Local site via a public URL using ddev share and ngrok by Mike Anello updated Mar 2020
Email Capture and Review
Mailpit is a mail catcher which is configured to capture and display emails sent in the development environment.
After your project is started, access the Mailpit web interface at http://mysite.ddev.site:8026 or use ddev mailpit to launch Mailpit.
Mailpit will not intercept emails if your application is configured to use SMTP or a third-party ESP integration.
If you’re using SMTP for outgoing mail—with Symfony Mailer or SMTP modules, for example—update your application’s SMTP server configuration to use localhost and Mailpit’s port 1025.
Solr and DDEV
Many sites require Solr for search. You can add Solr to your DDEV project but it has some complexities. Here is a way to get it set up.
# To install, run
ddev add-on get ddev/ddev-solr
ddev restart
If you don't see the latest version of Solr (currently ver 9.6.1), you could add a .ddev/docker-compose.solr_extra.yml to override the image. This step was not necessary for my setup but it may be useful for customization:
services:
  solr:
    image: solr:9
You will need to restart the project with ddev restart to see the changes.
Once up and running, access Solr's admin UI within your browser by opening https://<projectname>.ddev.site:8943. For example, if the project is named "myproject" the hostname will be https://myproject.ddev.site:8943.
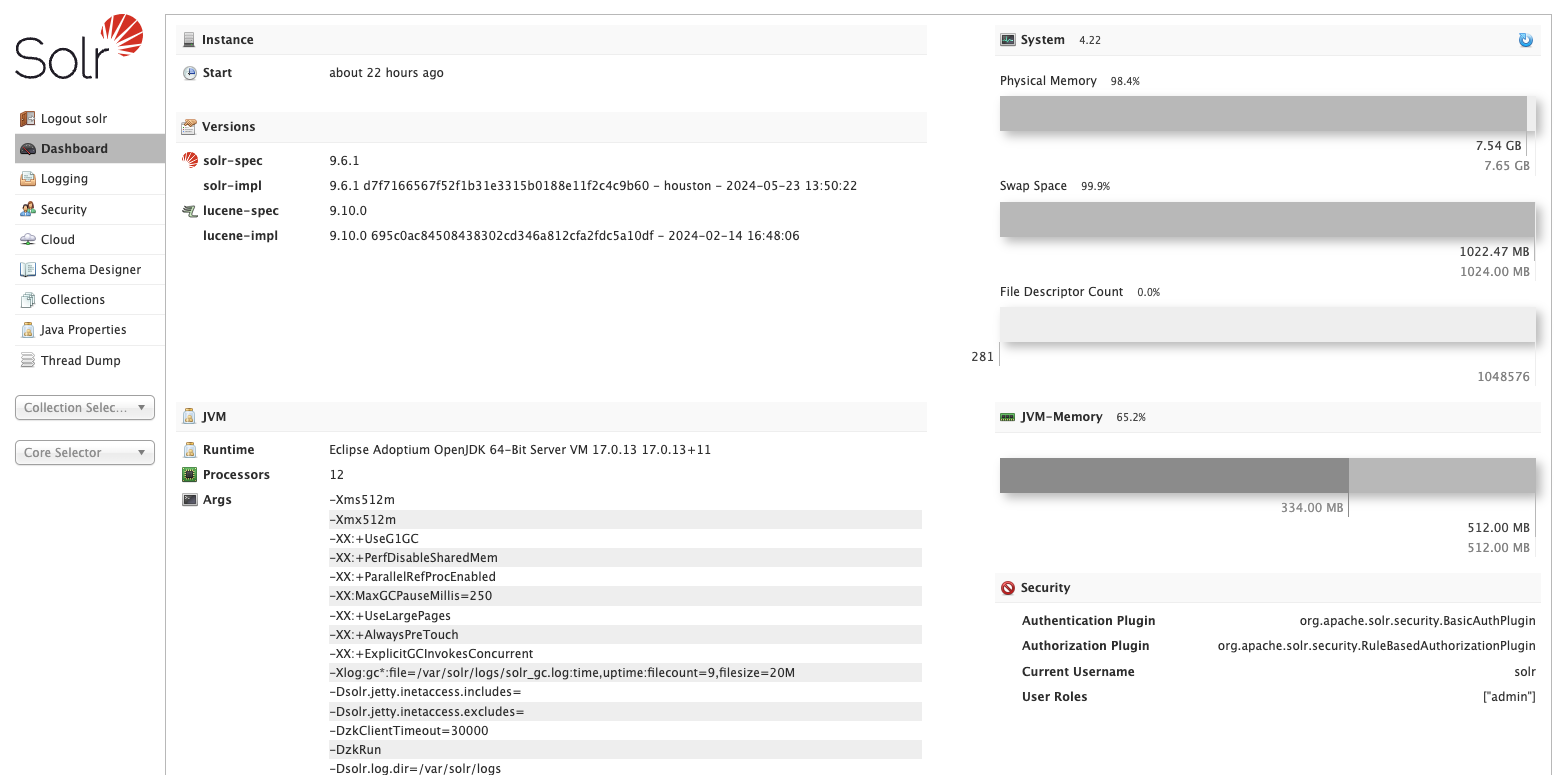
The admin UI is protected by basic authentication. The preconfigured admin account in security.json is user solr and the password SolrRocks.
To access the Solr container from DDEV's web container (i.e. from within Drupal), use http://solr:8983.
Note
Don't use localhost for the name of the Solr server in your search api configuration. Use solr instead. Also, there is no need to create a core or collection. The search api can do that for you by just clicking a button called +upload configset which appears after you define a solr server.
More at the ddev-solr repo
To use the Solr data for searching your Drupal site, use the Search API solr module and the Search API module. Detailed setup instructions below at Local Solr setup with Search API
DDEV provides some command line tools to help you manage your Solr instance. You can see the available commands by running ddev solr:
ddev solr
Usage: solr COMMAND OPTIONS
       where COMMAND is one of: start, stop, restart, status, healthcheck, create, create_core, create_collection, delete, version, zk, auth, assert, config, export, api, package, post, postlogs
Solr uses a program called zookeeper to manage some of the configuration of the Solr server. This is abbreviated as zk in the commands.
Xdebug and DDEV
This is a magical match made in heaven. To enable or disable Xdebug use
$ ddev xdebug on
and
$ ddev xdebug off
Note, this will slow everything down because xdebug has a significant performance impact so be sure to disable it when you are finished with your debugging session.
In PhpStorm, you can uncheck the following settings:
- force break at first line when no path mapping is specified
- force break at first line when a script is outside the project
For phpstorm, if you start listening for a debug connection, it should automatically try to create a debug server config for you. If it doesn't manually create one using the following values:
e.g
- name: tea.ddev.site
- host tea.ddev.site
- port: 80
- debugger: xdebug
- check use path mappings
- for docroot specify: /var/www/html/docroot (i.e. wherever index.php is)
For Lando, check out: How to configure xdebug with Lando & VS code for Drupal Development - Apr 2023 also Lando + PHPStorm + Xdebug in the Lando docs - Updated Nov 2023
Command line or drush debugging
For command line or drush debugging (Xdebug, PhpStorm)
ddev sshconfirm debug is turned on
php -i | grep debugYou should see:
xdebug support => enabledConfigure the server to use path mappings
/Users/selwyn/Sites/ddev 82 ---> /var/www/html
click listen for debug connections button
set breakpoint and run
replace d8git.ddev.site with the name of your project
Note that with Drush 13+ you must set DRUSH_ALLOW_XDEBUG=1 or run drush --xdebug for debugging to work.
Use drush commands in your shell with DDEV
If you do local development, you can use syntax like ddev drush cst to execute drush commands in the container. This is slower than running on your native system because they are executed in the container but I prefer using drush directly on the host computer as I get to the benefits of Oh My Zsh.
To do this, install PHP as well drush globally. Then, follow the steps to install drushonhost. Once these are working, you can cd into the project directory and issue commands like drush cr, drush cst or drush cim -y etc. It is so very quick and smooth. (Note, this is the case with MacOS and Linux and I suspect it should work fine on WSL2 on Windows.)
Download a Drupal database and load it locally
You can download a Drupal database using drush sql-dump and then import it into the local site with the sequence of commands listed below. Using drush aliases with a site called abc where you want to import the prod (production) database:
drush @abc.prod sql-dump >dbprod.sql
gzip dbprod.sql
ddev import-db --src=dbprod.sql.gz
This works with any site where you've set up your drush aliases including Acquia.
Note
If you see the following error: mysqldump: Error: 'Access denied; you need (at least one of) the PROCESS privilege(s) for this operation' when trying to dump tablespaces you can rather use:
drush @abc.prod sql-dump --extra-dump=--no-tablespaces > dbprod.sql
MySQL configuration
DDEV allows you to configure MySQL settings in the .ddev/mysql directory. You can add a anything.cnf file to this directory to configure MySQL settings. This is useful for setting up a local development environment that matches your production environment.
For example, in file .ddev/mysql/fix_max_allowed_packet.cnf I tried the following:
[mysqld]
max_allowed_packet = 768M
I was able to check a value from the MySQL configuration with:
ddev mysqlThen once you see the mysql> prompt, type:
show variables like 'max_allowed_packet';
+--------------------+-----------+
| Variable_name      | Value     |
+--------------------+-----------+
| max_allowed_packet | 805306368 |
+--------------------+-----------+
1 row in set (0.00 sec)
I was trying to dump a database and saw the following:
ddev drush sql-dump >dbdump1.sql
> mysqldump: Error: 'Access denied; you need (at least one of) the PROCESS privilege(s) for this operation' when trying to dump tablespaces
> mysqldump: Error 2020: Got packet bigger than 'max_allowed_packet' bytes when dumping table `key_value` at row: 87620

In SqlCommands.php line 215:

  Unable to dump database. Rerun with --debug to see any error message.

Failed to run drush sql-dump: exit status 1
I've seen the Access denied error but I don't think it is significant, so I usually ignore it. The max_allowed_packet one is a little more dire. This stackoverflow question suggested creating a [mysqldump] section and setting max_allowed_packet = 512M in the my.cnf file. This did not work for me. I tried setting it to 768M, 1024 and even 4096 but no luck. I'm guessing there is some corruption in the database I was using.
Windows DDEV setup
Randy Fay recorded a video on how to set up DDEV on Windows in July 2025 which you might find useful. The DDEV docs have an installation guide for windows and a Windows Quickstart guide.
Cleanup some disk space
Free up disk space used by previous docker image versions. This does no harm.
ddev delete imagesalso
docker system pruneand
docker image prune -aList all docker volumes
docker volume lsRead more about DDEV General cleanup
Accessing specific containers
To ssh into a specific service e.g. from a docker-composer.chromedriver.yml the service is listed under "services:" like:
services:
  chromedriver
Use
ddev ssh -s chromedriver
or for selenium, use:
ddev ssh -s selenium
How to add Java to the DDEV container
If you find yourself needing Java in the container, you can add it to your .ddev/config.local.yaml file like this:
webimage_extra_packages: [ default-jre ]then restart DDEV with ddev restart.
Note, you can specify a specific version of Java like openjdk-11-jre-headless (Java 11) or openjdk-17-jre-headless (Java 17).
Drupal Multisite and DDEV
I'm not a huge fan of multisite for many reasons but if you need to set it up, here are the steps. You should be aware that there are some variations that you can use for multisite.
- Create a separate database for each site.
- Share the same database and use prefixes for the tables.
- Probably a zillion other ways to do it including using a different database server for each site.
Also, Why Pantheon thinks multisite is a bad idea - June 2017
Thanks to Aastha Shrivastava for her article Setting up drupal9 multi-site with DDEV as well as Russell Jones's Youtube video: Easy Drupal 10 Multi-Site Setup with DDEV | Get Started in Minutes! for their excellent work informing this section.
Using different databases
This is a cleaner way to do multisite as the data is slightly more isolated.
I created a dmulti git repo which has a multisite setup with 3 subsites using the different databases for each subsite. You can clone it and run ddev start to see it working.
Here are the steps to create the dmulti project with a main site dmulti and 3 subsites called dmultisite1, dmultisite2 and dmultisite3 each in it's own database.
- Get Drupal installed in a directory called
dmulti. From the DDEV Docs CMS Quickstart: Drupal 10
mkdir dmulti && cd dmulti
ddev config --project-type=drupal10 --docroot=web
ddev start
ddev composer create drupal/recommended-project:^10
ddev composer require drush/drush
ddev drush site:install --account-name=admin --account-pass=admin -y
ddev launch
# or automatically log in with
ddev launch $(ddev drush uli)- Add additional hostnames in the
.ddev/config.yamlfile under additional_hostnames. Here we add 3 subsites underadditional_hostnames:
name: dmulti
type: drupal10
docroot: web
php_version: "8.3"
webserver_type: nginx-fpm
xdebug_enabled: false
additional_hostnames:
  - dmultisite1
  - dmultisite2
  - dmultisite3
additional_fqdns: []
database:
    type: mariadb
    version: "10.11"
use_dns_when_possible: true
composer_version: "2"
web_environment: []
corepack_enable: false- Create the
dmultisite1,dmultisite2anddmultisite3directories in theweb/sitesdirectory.
Kinda like this: 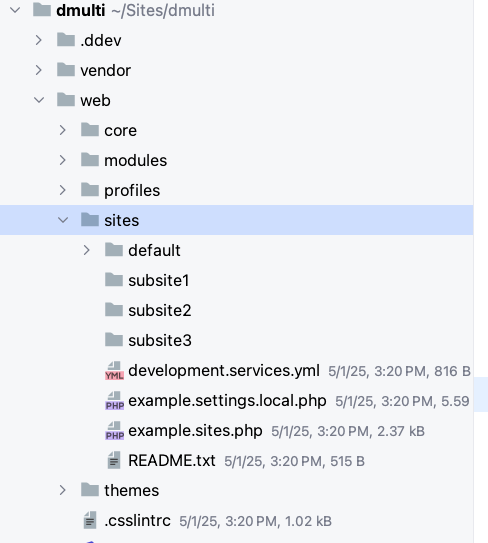
- Copy
examples.sites.phptosites.phpand add the entries for the subsites in yourweb/sites/sites.phpfile:
$sites['dmultisite1.ddev.site'] = 'dmultisite1';
$sites['dmultisite2.ddev.site'] = 'dmultisite2';
$sites['dmultisite3.ddev.site'] = 'dmultisite3';- In order to let Drupal know about the subsites and the separate databases, we will need a
settings.phpfile as well as asettings.ddev.phpin each of the subsite directories. Copy thesites/default/settings.phpandsites/default/settings.ddev.phpfiles into each of the subsite directories
DDEV will have already set up the web/sites/settings.php file correctly for you. Confirm that it looks like this at the bottom of the file:
// Automatically generated include for settings managed by ddev.
if (getenv('IS_DDEV_PROJECT') == 'true' && file_exists(__DIR__ . '/settings.ddev.php')) {
  include __DIR__ . '/settings.ddev.php';
}

/**
 * Load local development override configuration, if available.
 *
 * Create a settings.local.php file to override variables on secondary (staging,
 * development, etc.) installations of this site.
 *
 * Typical uses of settings.local.php include:
 * - Disabling caching.
 * - Disabling JavaScript/CSS compression.
 * - Rerouting outgoing emails.
 *
 * Keep this code block at the end of this file to take full effect.
 */
#
# if (file_exists($app_root . '/' . $site_path . '/settings.local.php')) {
#   include $app_root . '/' . $site_path . '/settings.local.php';
# }- Update the
sites/dmultisite1/settings.ddev.phpfiles in each directory to look like this:
...
<?php
$host = "db";
$port = 3306;
$driver = "mysql";

$databases['default']['default']['database'] = "site1";
$databases['default']['default']['username'] = "site1";
$databases['default']['default']['password'] = "site1";
$databases['default']['default']['host'] = $host;
$databases['default']['default']['port'] = $port;
$databases['default']['default']['driver'] = $driver;
...
This will cause Drupal to use the correct database for each subsite.
Note, change the database name, username and password for each subsite in the settings.ddev.php file.
- Restart ddev with
ddev restartand useddev statusto see the new URLs.
Here is the output from ddev status:
┌────────────────────────────────────────────────────────────────────────────────────────┐
│ Project: dmulti ~/Sites/dmulti https://dmulti.ddev.site                                │
│ Docker platform: docker-desktop                                                        │
│ Router: traefik                                                                        │
├──────────────┬──────┬─────────────────────────────────────────────┬────────────────────┤
│ SERVICE      │ STAT │ URL/PORT                                    │ INFO               │
├──────────────┼──────┼─────────────────────────────────────────────┼────────────────────┤
│ web          │ OK   │ https://dmulti.ddev.site                    │ drupal10 PHP 8.3   │
│              │      │ InDocker -> Host:                           │ Server: nginx-fpm  │
│              │      │  - web:80 -> 127.0.0.1:60094                │ Docroot: 'web'     │
│              │      │  - web:443 -> 127.0.0.1:60093               │ Perf mode: mutagen │
│              │      │  - web:8025 -> 127.0.0.1:60095              │ Node.js: 22        │
├──────────────┼──────┼─────────────────────────────────────────────┼────────────────────┤
│ db           │ OK   │ InDocker -> Host:                           │ mariadb:10.11      │
│              │      │  - db:3306 -> 127.0.0.1:60092               │ User/Pass: 'db/db' │
│              │      │                                             │ or 'root/root'     │
├──────────────┼──────┼─────────────────────────────────────────────┼────────────────────┤
│ phpmyadmin   │ OK   │ https://dmulti.ddev.site:8037               │                    │
│              │      │ InDocker:                                   │                    │
│              │      │  - phpmyadmin:80                            │                    │
├──────────────┼──────┼─────────────────────────────────────────────┼────────────────────┤
│ Mailpit      │      │ Mailpit: https://dmulti.ddev.site:8026      │                    │
│              │      │ Launch: ddev mailpit                        │                    │
├──────────────┼──────┼─────────────────────────────────────────────┼────────────────────┤
│ Project URLs │      │ https://dmulti.ddev.site,                   │                    │
│              │      │ https://dmultisite1.ddev.site,              │                    │
│              │      │ https://dmultisite2.ddev.site,              │                    │
│              │      │ https://dmultisite3.ddev.site,              │                    │
│              │      │ https://127.0.0.1:60093,                    │                    │
│              │      │ http://dmulti.ddev.site,                    │                    │
│              │      │ http://dmultisite1.ddev.site,               │                    │
│              │      │ http://dmultisite2.ddev.site,               │                    │
│              │      │ http://dmultisite3.ddev.site,               │                    │
│              │      │ http://127.0.0.1:60094                      │                    │
└──────────────┴──────┴─────────────────────────────────────────────┴────────────────────┘- Follow the instructions at DDEV phpMyAdmin to install phpMyAdmin. You can use the
ddev phpmyadmincommand to access phpMyAdmin. You should see a database calleddbfor the main site.
ddev add-on get ddev/ddev-phpmyadmin
ddev restart- Now for the databases. DDEV automatically created the main site database. In PHPMyAdmin, add 3 users called
site1,site2andsite3each with a user and password ofsite1,site2andsite3respectively and also create a database for each user.
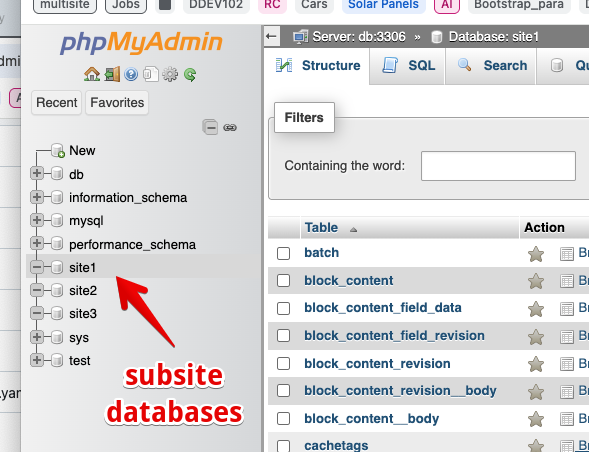
You should now be able to navigate to each subsite e.g.
http://dmultisite1.ddev.siteand follow the prompts to install Drupal.You can use
ddev drush -l dmultisite1 ulito get a login url for each subsite. Notice that the URLs will not be correct for the subsites. Check out Drush aliases for multisite below to see how to fix this.
Note
You can use ddev drush -l dmultisite1 status to see the status of the subsite.
Backup and restore the database for a subsite
To export a database, use ddev export-db with the -d option to specify the database to export from (default "db") e.g.
ddev export-db -d site1 -f dbsite1.sql.gzThis will create a file called dbsite1.sql.gz in the current directory.
To restore (import) a database for a subsite, use ddev import-db -d site1 --file=dbdump1.sql.gz
You can also use drush. E.g. to backup the database for a subsite dmultusite1 with drush, use:
ddev drush -l dmultisite1 sql-dump >dbdump1.sqland to restore it, use:
ddev drush -l dmultisite1 sqlc < dbdump1.sqlUsing Prefixes
This is the worst way to set up a multisite. It puts all the tables in the same database and uses prefixes to separate them. This is not a good idea because it can lead to confusion and make it difficult to manage the database. It also makes it harder to migrate a site to a different server or hosting provider.
I created a d10m git repo which has a multisite setup with 3 subsites using the same database and prefixes for the tables. You can clone it and run ddev start to see it working.
Here are the steps to create the d10m project with a main site d10m and 3 subsites called subsite1, subsite2 and subsite3.
Here are the steps:
- Get Drupal installed in a directory called
d10m. From the DDEV Docs CMS Quickstart: Drupal 10
mkdir d10m && cd d10m
ddev config --project-type=drupal10 --docroot=web
ddev start
ddev composer create drupal/recommended-project:^10
ddev composer require drush/drush
ddev drush site:install --account-name=admin --account-pass=admin -y
ddev launch
# or automatically log in with
ddev launch $(ddev drush uli)
Confirm that the site is running correctly by clicking around and creating content.
- Add additional hostnames in the
.ddev/config.yamlfile under additional_hostnames. Here we add 3 subsites underadditional_hostnames:
name: d10m
type: drupal10
docroot: web
php_version: "8.3"
webserver_type: nginx-fpm
xdebug_enabled: false
additional_hostnames:
  - subsite1
  - subsite2
  - subsite3
additional_fqdns: []
database:
    type: mariadb
    version: "10.11"
use_dns_when_possible: true
composer_version: "2"
web_environment: []
corepack_enable: false- Follow the instructions at DDEV PhpMyAdmin to install phpMyAdmin. You can use the
ddev phpmyadmincommand to access phpMyAdmin. You should see a database calleddbfor the main site.
ddev add-on get ddev/ddev-phpmyadmin
ddev restart- Create the
subsite1,subsite2andsubsite3directories in theweb/sitesdirectory.

- Copy
examples.sites.phptosites.phpand add the entries for the subsites in yourweb/sites/sites.phpfile:
   $sites['subsite1.ddev.site'] = 'subsite1';
   $sites['subsite2.ddev.site'] = 'subsite2';
   $sites['subsite3.ddev.site'] = 'subsite3';
After a ddev restart, use ddev status to see all the URLs as well as the additional hostnames listed:
ddev status
┌─────────────────────────────────────────────────────────────────────────────────┐
│ Project: d10m ~/Sites/d10m https://d10m.ddev.site                               │
│ Docker platform: docker-desktop                                                 │
│ Router: traefik                                                                 │
├──────────────┬──────┬──────────────────────────────────────┬────────────────────┤
│ SERVICE      │ STAT │ URL/PORT                             │ INFO               │
├──────────────┼──────┼──────────────────────────────────────┼────────────────────┤
│ web          │ OK   │ https://d10m.ddev.site               │ drupal10 PHP 8.3   │
│              │      │ InDocker -> Host:                    │ Server: nginx-fpm  │
│              │      │  - web:80 -> 127.0.0.1:65316         │ Docroot: 'web'     │
│              │      │  - web:443 -> 127.0.0.1:65318        │ Perf mode: mutagen │
│              │      │  - web:8025 -> 127.0.0.1:65317       │ Node.js: 22        │
├──────────────┼──────┼──────────────────────────────────────┼────────────────────┤
│ db           │ OK   │ InDocker -> Host:                    │ mariadb:10.11      │
│              │      │  - db:3306 -> 127.0.0.1:65315        │ User/Pass: 'db/db' │
│              │      │                                      │ or 'root/root'     │
├──────────────┼──────┼──────────────────────────────────────┼────────────────────┤
│ phpmyadmin   │ OK   │ https://d10m.ddev.site:8037          │                    │
│              │      │ InDocker:                            │                    │
│              │      │  - phpmyadmin:80                     │                    │
├──────────────┼──────┼──────────────────────────────────────┼────────────────────┤
│ Mailpit      │      │ Mailpit: https://d10m.ddev.site:8026 │                    │
│              │      │ Launch: ddev mailpit                 │                    │
├──────────────┼──────┼──────────────────────────────────────┼────────────────────┤
│ Project URLs │      │ https://d10m.ddev.site,              │                    │
│              │      │ https://subsite1.ddev.site,          │                    │
│              │      │ https://subsite2.ddev.site,          │                    │
│              │      │ https://subsite3.ddev.site,          │                    │
│              │      │ https://127.0.0.1:65318,             │                    │
│              │      │ http://d10m.ddev.site,               │                    │
│              │      │ http://subsite1.ddev.site,           │                    │
│              │      │ http://subsite2.ddev.site,           │                    │
│              │      │ http://subsite3.ddev.site,           │                    │
│              │      │ http://127.0.0.1:65316               │                    │
└──────────────┴──────┴──────────────────────────────────────┴────────────────────┘- In order to let Drupal know about the prefixes, we will need a
settings.phpfile in each of the subsite directories. Copy thesites/default/settings.phpinto each of the subsite directories. Then add this towards the bottom of the file:
if (file_exists($app_root  . '/sites/default/settings.ddev.php') && getenv('IS_DDEV_PROJECT') == 'true') {
  include $app_root . '/sites/default/settings.ddev.php';
}
# change subsite1 to the name of your subsite.
$databases['default']['default']['prefix'] = 'subsite1_';
This will cause Drupal to use the web/sites/default/settings.ddev.php file in the main site directory ($app_root/sites/default/settings.ddev.php) which has these settings:
$host = "db";
$port = 3306;
$driver = "mysql";

$databases['default']['default']['database'] = "db";
$databases['default']['default']['username'] = "db";
$databases['default']['default']['password'] = "db";
$databases['default']['default']['host'] = $host;
$databases['default']['default']['port'] = $port;
$databases['default']['default']['driver'] = $driver;
The prefix will be added to the table names in the database by the settings.ddev.php in each subsite's directory. For example, if you have a table called node in the main site, it will be called subsite1_node in the subsite. Note, if you leave off the trailing underscore, it will be called subsite1node which is not as clear.
If you run any of the subsites by navigating to http://subsite1.ddev.site or http://subsite2.ddev.site etc. Follow the prompts to install Drupal. 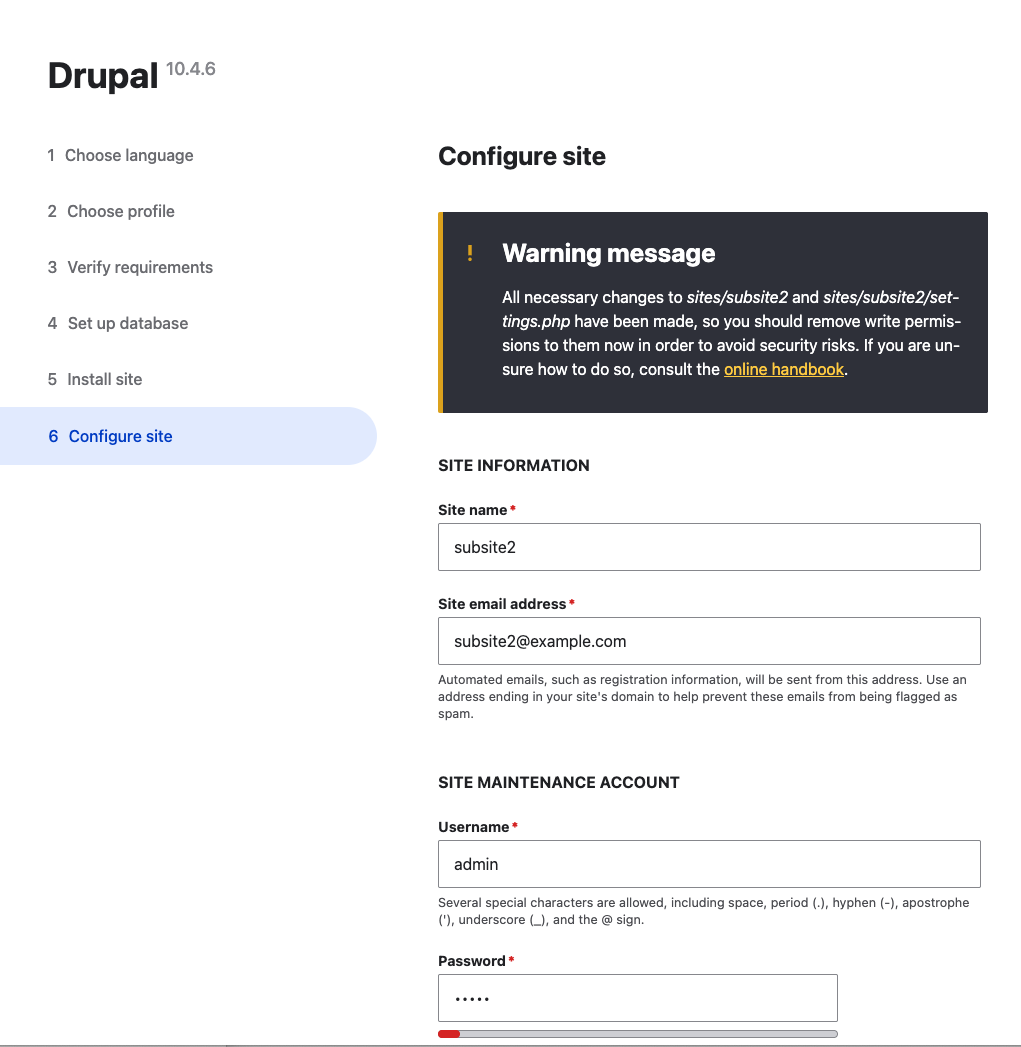
Optionally, you could potentially use the ddev drush site:install command to install the subsite. Unfortunately, it prompts to drop all tables in the database which will remove all the tables for the other subsites, regardless of prefix or not. Rather, use the web interface to install the site.
ddev drush site:install --db-url=mysql://db:db@db:3306/db --account-name=admin --account-pass=admin --site-name="Subsite 3" --db-prefix=subsite3_ --sites-subdir=subsite3 --site-mail=subsite3@example.com```

You can look at the drush status of a subsite with: `ddev drush -l subsite2 status`:

```sh
ddev drush -l subsite2 status
Drupal version   : 10.4.6
Site URI         : http://subsite2
DB driver        : mysql
DB hostname      : db
DB port          : 3306
DB username      : db
DB name          : db
Database         : Connected
Drupal bootstrap : Successful
Default theme    : olivero
Admin theme      : claro
PHP binary       : /usr/bin/php8.3
PHP config       : /etc/php/8.3/cli/php.ini
PHP OS           : Linux
PHP version      : 8.3.19
Drush script     : /var/www/html/vendor/bin/drush.php
Drush version    : 13.6.0.0
Drush temp       : /tmp
Drush configs    : /var/www/html/vendor/drush/drush/drush.yml
Install profile  : standard
Drupal root      : /var/www/html/web
Site path        : sites/subsite2
Files, Public    : sites/subsite2/files
Files, Temp      : /tmp
Drupal config    : sites/default/files/sync
Drush for multisite
Be sure to use the -l option to specify the subsite you want to run the command on. For example, to clear the cache for subsite1, use:
ddev drush -l subsite1 crAlso, if you need the correct URL to be output by drush use the --uri option to specify the correct URL. For example:
ddev drush --uri=https://subsite1.ddev.site uli
https://subsite1.ddev.site/user/reset/1/174615/imZKgw0PxVDsPJJWihBUjlOyx-2NkV7Lwc/login
Drush aliases for multisite
You can set up a drush alias for the subsites where you specify each URI in ~/Sites/d10m/drush/sites/self.site.yml For example:
subsite1:
  root: /var/www/html/web
  uri: https://subsite1.ddev.site
subsite2:
  root: /var/www/html/web
  uri: https://subsite2.ddev.site
subsite3:
  root: /var/www/html/web
  uri: https://subsite3.ddev.site
Then, specify the drush alias when running any drush commands, such as uli:
ddev drush @self.subsite1 uli
https://subsite1.ddev.site/user/reset/1/1746199179/uwMRyywm_W45tbW9yuuCEbeCy7KA6WJhbmV9krHVbbw/login
and
ddev drush @self.subsite2 en admin_toolbar -yNote, the drush directory is at the same level as the web or docroot directory. Also, if you call the file selwyn.site.yml, you can use ddev drush @selwyn.subsite1 uli etc. See Drush aliases for more info.
Problems with multisite
I've seen some problems with drush uli command.
ddev drush uli
https://d10m.ddev.site/user/reset/1/1746197983/FzB_nebAqHFZmdsBJXpjYC_wjx7RAgjL352qZyaz81M/login
This will give you a one-time login link for the main site. To get a one-time login link for the subsite, use:
ddev drush -l subsite1 uli
http://subsite1/user/reset/1/1746197975/XGX2vNVlVwQ6fIAzE9HATNniNMOLbz8dN63UAUtb_cw/login
Notice that the URL for this command is wrong. It should be https://subsite1.ddev.site/user/reset/1/1746197975/XGX2vNVlVwQ6fIAzE9HATNniNMOLbz8dN63UAUtb_cw/login but it is not. This is a bug in drush.
You can work around this by using the --uri option to specify the correct URL. For example:
ddev drush --uri=https://subsite1.ddev.site uli
https://subsite1.ddev.site/user/reset/1/1746198785/imZKgctexfaXuUw0PxVDsPJJWihBUjlOyx-2NkV7Lwc/login
Additionally, you can set up a drush alias for the subsites where you specify each URI in drush/sites/self.site.yml (at the same level as the .ddev directory. e.g. at ~/Sites/d10m/drush/sites/self.site.yml) For example:
subsite1:
  root: /var/www/html/web
  uri: https://subsite1.ddev.site
subsite2:
  root: /var/www/html/web
  uri: https://subsite2.ddev.site
subsite3:
  root: /var/www/html/web
  uri: https://subsite3.ddev.site
Then, specify the drush alias when running the uli command:
ddev drush @self.subsite1 uli
https://subsite1.ddev.site/user/reset/1/1746199179/uwMRyywm_W45tbW9yuuCEbeCy7KA6WJhbmV9krHVbbw/login
and
ddev drush @self.subsite2 uli
https://subsite2.ddev.site/user/reset/1/1746199233/TNYXEGePpgXweOukz_yg-4fRWj6x3DYohOQ-QQwvXYg/login
Note, this drush directory is at the same level as the web or docroot directory.
If DDEV reports problems in the site listing such as this:

A quick look at the mutagen status output may show you that there are transition problems:
ddev mutagen status -l

...
	Transition problems:
		web/sites/subsite3_/files: unable to remove directory: permission denied
		web/sites/subsite3_/settings.php: unable to remove file: permission denied
You can resolve this by adding upload_dirs to the .ddev/config.yaml file:
upload_dirs:
  - sites/default/files
  - sites/subsite1/files
  - sites/subsite2/files
  - sites/subsite3/files
DDEV Troubleshooting
Be sure to check the support channels for DDEV, especially the DDEV Discord for help. If you want to post about a problem, the folks there will usually want to see the output of ddev debug test ( e.g. on the host: /var/folders/4m/sp0m3vwj71g9n0nlv83mzbnr0000gp/T/ddev-debug-test.txt) and ddev describe commands so have those ready. I recommend you reach out to the DDEV community for help with any issues you may have. You will be pleasantly surprised at how helpful they can be.
Why is DDEV doing strange things?
You can find out what it’s doing, use DDEV_DEBUG=true ddev start or even DDEV_VERBOSE=true ddev start. This will display all sorts of debug or verbose information which might give you more information on problems.
Running out of docker disk space
if ddev won't start and shows:
Creating ddev-router ... done
Failed to start ddev82: db container failed: log=, err=container exited, please use 'ddev logs -s db` to find out why it failed
Looking in the log, you might see:
preallocating 12582912 bytes for file ./ibtmp1 failed with error 28
2020-03-16 14:27:54 140144158233920 [ERROR] InnoDB: Could not set the file size of './ibtmp1'. Probably out of disk space
That is the clue.
You can kill off images using
ddev delete imagesor the more drastic
docker rmi -f $(docker images -q)Q. Deleting the images: Does that mean it will delete the db snapshots? A. No, docker images are the versioned images that come from dockerhub, they're are always replaceable. Absolutely nothing you do with ddev will delete your snapshots - you have to remove them manually. They're stored in .ddev/db_snapshots on the host (under each project)
also
docker system pruneand this command prunes every single thing, destroys all ddev databases and your composer cache.
docker system prune --volumesDDEV won't start
ddev pull or ddev start failed with an error, something like:
Pull failed: db container failed: log=, err=health check timed out: labels map[com.ddev.site-name:inside-mathematics com.docker.compose.service:db] timed out without becoming healthy, status=Or like this:
$ ddev start
Starting inside-mathematics...
Pushing mkcert rootca certs to ddev-global-cache
Pushed mkcert rootca certs to ddev-global-cache
Creating ddev-inside-mathematics-db ... done
Creating ddev-inside-mathematics-dba ... done
Creating ddev-inside-mathematics-web ... done

Creating ddev-router ... done

Failed to start inside-mathematics: db container failed: log=, err=health check timed out: labels map[com.ddev.site-name:inside-mathematics com.docker.compose.service:db] timed out without becoming healthy, status=
This is almost always caused by a corrupted database, most often in a larger database. Unfortunately, both Docker for Windows and Docker for Mac shut down without notifying the container during upgrade, with a manual Docker exit, or at system shutdown. It can be avoided by stopping or removing your projects before letting Docker exit.
To fix, ddev delete --omit-snapshot -y, then ddev start.
DDEV list shows running (problems)
Notice how ddev list shows the status of the project as running (problems). This is an issue with Mutagen.
ddev list -A
┌────────┬────────────────────┬──────────────────────┬─────────────────────────┬──────────┐
│ NAME   │ STATUS             │ LOCATION             │ URL                     │ TYPE     │
├────────┼────────────────────┼──────────────────────┼─────────────────────────┼──────────┤
│ agov3  │ running (ok)       │ ~/Sites/agov3/drupal │ https://agov3.ddev.site │ drupal10 │
├────────┼────────────────────┼──────────────────────┼─────────────────────────┼──────────┤
│ agov4  │ running (problems) │ ~/Sites/agov4/drupal │ https://agov4.ddev.site │ drupal10 │
├────────┼────────────────────┼──────────────────────┼─────────────────────────┼──────────┤
│ Router │ OK                 │ ~/.ddev              │ http://127.0.0.1:10999  │          │
└────────┴────────────────────┴──────────────────────┴─────────────────────────┴──────────┘
Note
Be sure to check the support channels for DDEV, especially the DDEV Discord for help. If you want to post about a problem, the folks there will usually want to see the output of ddev debug test ( e.g. on the host: /var/folders/4m/sp0m3vwj71g9n0nlv83mzbnr0000gp/T/ddev-debug-test.txt) and ddev describe commands so have those ready.
Check the status of Mutagen with:
ddev mutagen st -lHere is the output:
Mutagen: problems:
--------------------------------------------------------------------------------
Name: agov4
Identifier: sync_sEpOVQ05Rzd27QOvP349xWoLmICcMSx7OgOVC5bDCWK
Labels:
	com.ddev.config-hash: a5bb90222a29c5639969092b524e248782845abb
	com.ddev.volume-signature: Users-selwyn-docker-run-1747061760
Configuration:
	Synchronization mode: Two Way Resolved
	Hashing algorithm: Default (SHA-1)
	Maximum allowed entry count: Default (2⁶⁴−1)
	Maximum staging file size: Default (18 EB)
	Symbolic link mode: POSIX Raw
	Ignore syntax: Default (Mutagen)
	Ignores:
		/.git
		/.tarballs
		/.ddev/db_snapshots
		/.ddev/.importdb*
		.DS_Store
		.idea
		/web/sites/default/files
		/web/sites/fai/files
	Ignore VCS mode: Default (Propagate)
	Permissions mode: Default (Portable)
Alpha:
	URL: /Users/selwyn/Sites/agov4/drupal
	Configuration:
		Watch mode: Default (Portable)
		Watch polling interval: Default (10 seconds)
		Probe mode: Default (Probe)
		Scan mode: Default (Accelerated)
		Stage mode: Neighboring
		File mode: Default (0600)
		Directory mode: Default (0700)
		Default file/directory owner: Default
		Default file/directory group: Default
	Connected: Yes
	Synchronizable contents:
		17610 directories
		131006 files (8.4 GB)
		11 symbolic links
	Transition problems:
		regulation/far/git/epub/Graphics/piid.png: unable to create file: unable to relocate staged file: file exists
		regulation/far/git/html/copypaste-AllTopic/Graphics/PIID.PNG: unable to create file: unable to relocate staged file: file exists
		regulation/far/git/html/copypaste-FullParts/Graphics/piid.png: unable to create file: unable to relocate staged file: file exists
Beta:
	URL: docker://ddev-agov4-web/var/www/html
		DOCKER_HOST=unix:///Users/selwyn/.docker/run/docker.sock
	Configuration:
		Watch mode: Default (Portable)
		Watch polling interval: Default (10 seconds)
		Probe mode: Default (Probe)
		Scan mode: Default (Accelerated)
		Stage mode: Neighboring
		File mode: Default (0600)
		Directory mode: Default (0700)
		Default file/directory owner: Default
		Default file/directory group: Default
		Compression: Default (DEFLATE)
	Connected: Yes
	Synchronizable contents:
		17610 directories
		131009 files (8.4 GB)
		11 symbolic links
Status: Watching for changes
--------------------------------------------------------------------------------
I think the issue is with this section:
	Transition problems:
		regulation/far/git/epub/Graphics/piid.png: unable to create file: unable to relocate staged file: file exists
		regulation/far/git/html/copypaste-AllTopic/Graphics/PIID.PNG: unable to create file: unable to relocate staged file: file exists
		regulation/far/git/html/copypaste-FullParts/Graphics/piid.png: unable to create file: unable to relocate staged file: file exists
I tried:
chmod -R 777 regulationBut that didn't seem to fix things even after a ddev restart.
From Troubleshooting Mutagen Sync Issues I saw that the ddev mutagen reset command can be used to reset the Mutagen synchronization.
This showed:
Mutagen has been reset. You may now `ddev start` with or without Mutagen enabled.This cleared up the problem, but it is not a long-term solution.
The solution (thanks to Randy Fay) was to add the following to my .ddev/config.local.yaml
upload_dirs:
  - sites/default/files
  - sites/fai/files
  - ../regulation
This tells DDEV to ignore the regulation directory and not try to sync it with Mutagen.
For more info, see DDEV documentation on upload_dirs.
Perhaps it would be useful to explain:
From Randy Fay:
The normal way that filesystems get mounted into a container is with a bind mount. That's the same as a network mount via NFS or whatever. It's a way to make a filesystem appear in one system from another.
But on macOS and Windows, bind-mounts are terribly slow for many contexts. So mutagen instead copies all the data and keeps it up-to-date.
And thanks to Deepseek:
This is about how DDEV (a tool for local web development) handles file directories where your website stores user-uploaded files (like images, documents, etc.).
upload_dirs Definition
This is a setting where you tell DDEV which folders contain user-uploaded files (e.g., sites/default/files in Drupal or a custom folder like ../private).
These folders can be inside or outside your website’s main directory (docroot), but they must be inside your project directory (the main folder where your website code lives).
Why It Matters for ddev import-files
When you run ddev import-files (to bring in uploaded files from another environment), DDEV looks in these folders to know where to put the files.
What’s a "Bind-Mount"?
A bind-mount is like a mirror—it lets a folder inside your Docker container (where DDEV runs) directly access a folder on your computer without copying files back and forth.
When Mutagen (a file-syncing tool) is enabled, files in upload_dirs are not synced with Mutagen because they’re directly bound to your local machine (faster access, no sync delays).
Example: Drupal with Two Upload Directories
By default, Drupal uses sites/default/files for uploads.
If you also want files stored in ../private, you’d list both:
yaml upload_dirs: ["sites/default/files", "../private"] This ensures ddev import-files and Mutagen handle both locations correctly.
Key Takeaways upload_dirs tells DDEV where your uploaded files live.
Bind-mounting makes these folders faster when using Mutagen (avoids slow syncing).
Useful if your project has multiple upload locations (e.g., default + custom folders).
Local Solr setup with Search API Solr
If you haven't already added Solr to your project, follow these steps to get solr installed in your ddev project first.
Solr Cloud is the "modern" (and simplest) way to run Solr. There are other ways, but this is the setup we'll cover here.
Starting from Search API Solr module version 4.2.1 you don't need to deal with collections or configsets manually anymore. You can enable the search_api_solr_admin submodule which is part of the Search API Solr module. Now you create or update your "collections" at any time by clicking the "Upload Configset" button on the Search API server details page (see installation steps below).
It is also possible to use drush to do this:
ddev drush --numShards=1 search-api-solr:upload-configset SEARCH_API_SERVER_IDAdd a Search API server
At /admin/config/search/search-api click on the "Add server" button.
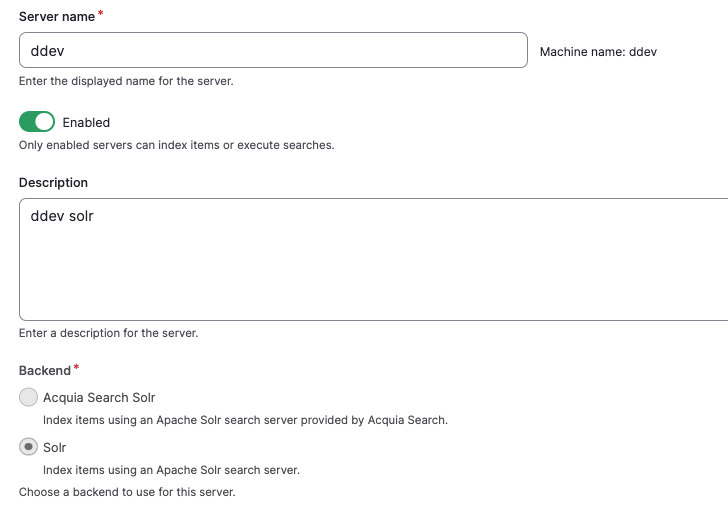
Name your server (for example, I called it ddev in the image below) and specify solr, not Acquia Search Solr
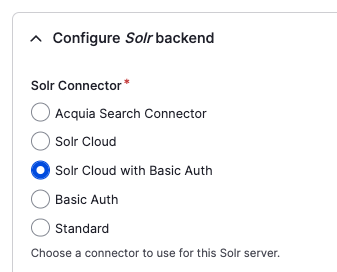
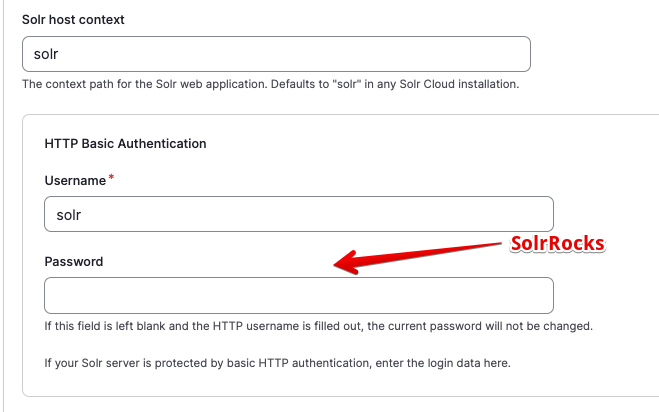
Specify Solr Cloud with Basic Auth so you can use the solr user and password SolrRocks.
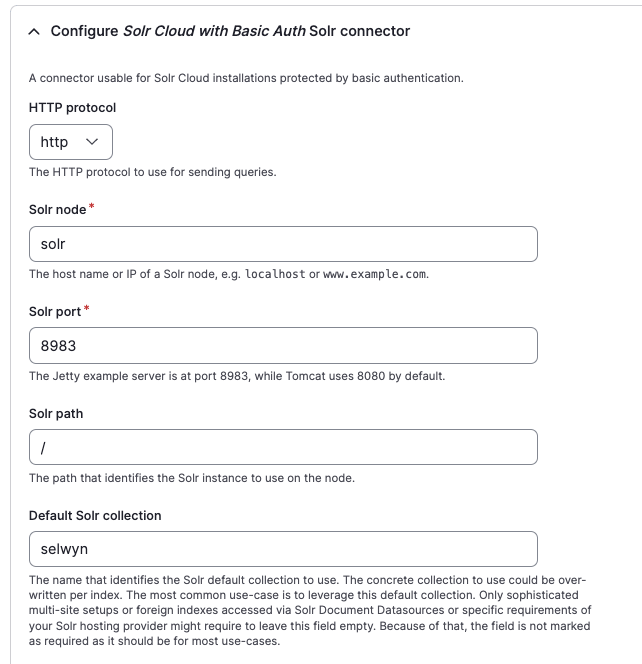
Specify the Solr node name: solr. Be sure not to use localhost as the server name. You will also need to specify a Default Solr collection. I used selwyn as the collection name.
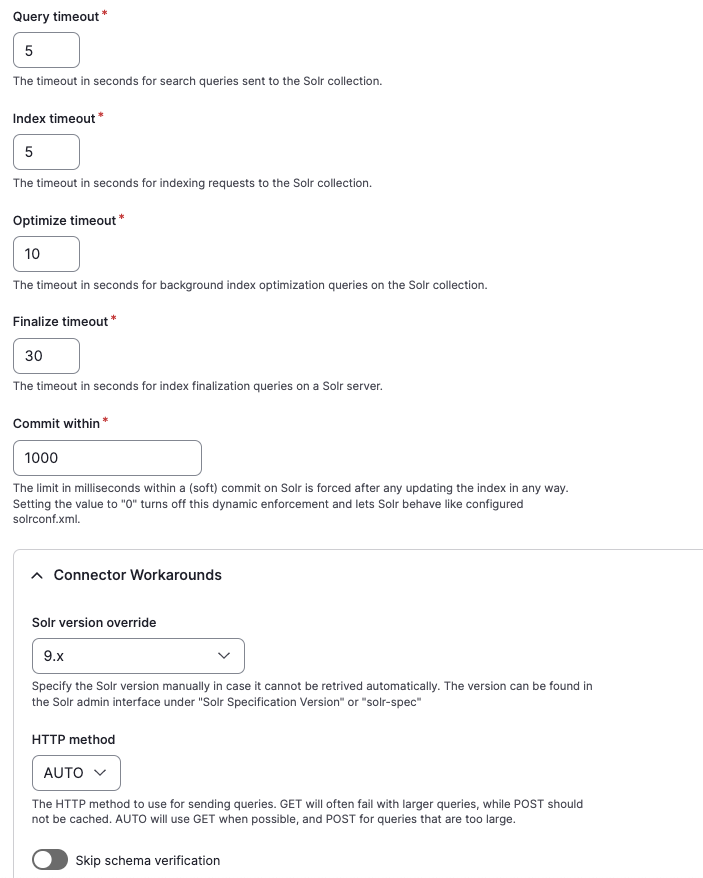
To tell Search API to use version 9 of Solr, specify 9.x in the Solr version override field.
Don't change any of the Advanced server configuration settings:
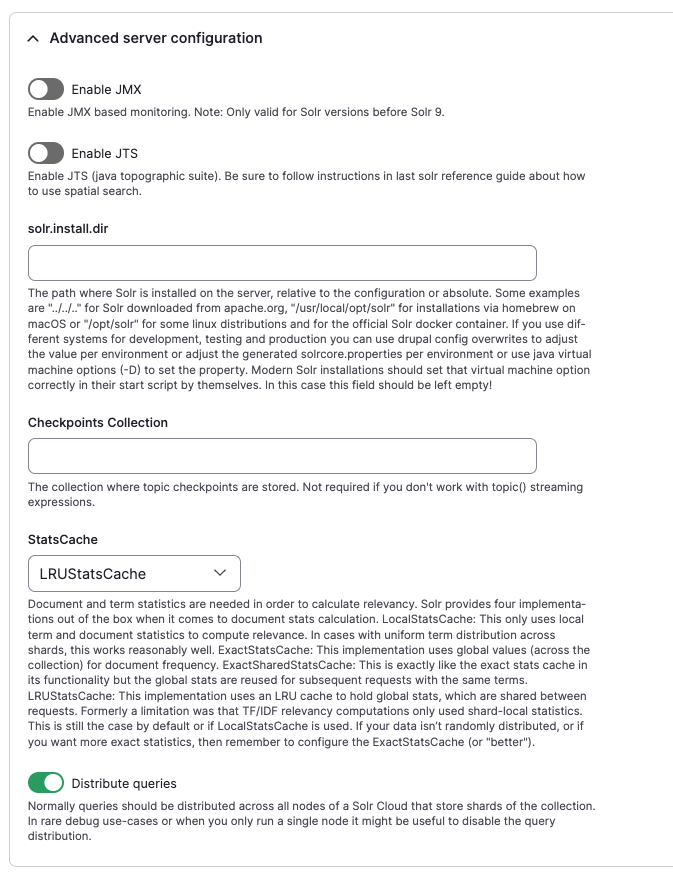
Specify solr as the Solr host context and put the solr user and password SolrRocks in the Username and `Password fields.
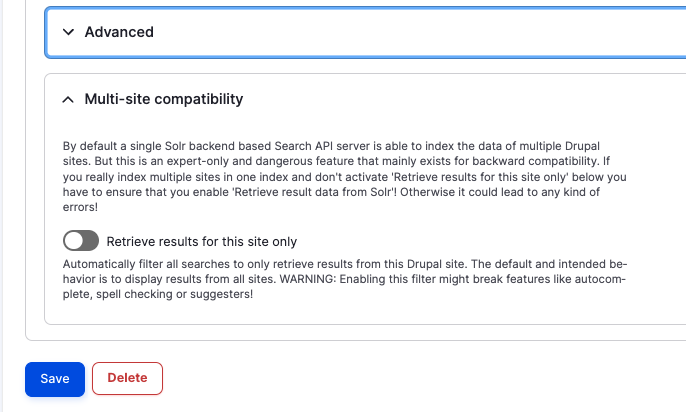
Leave the default values for Advanced and Multi-site compatibility:
More at Search API Solr module README
Install schema
You can do this in different ways. The easiest way is to use the +Upload Configset button on the server page. Ignore the error message saying: No existing configset name could be detected on the Solr server for this collection. That is fine if you are creating a new collection... On the next screen, click the Upload and create collection button near the bottom of the screen.
Alternatively, you can also use the + Get config.zip button from the view server page at /admin/config/search/search-api/server/ddev to download a config.zip file. The contents of this file can be loaded by ddev on a restart. More below:
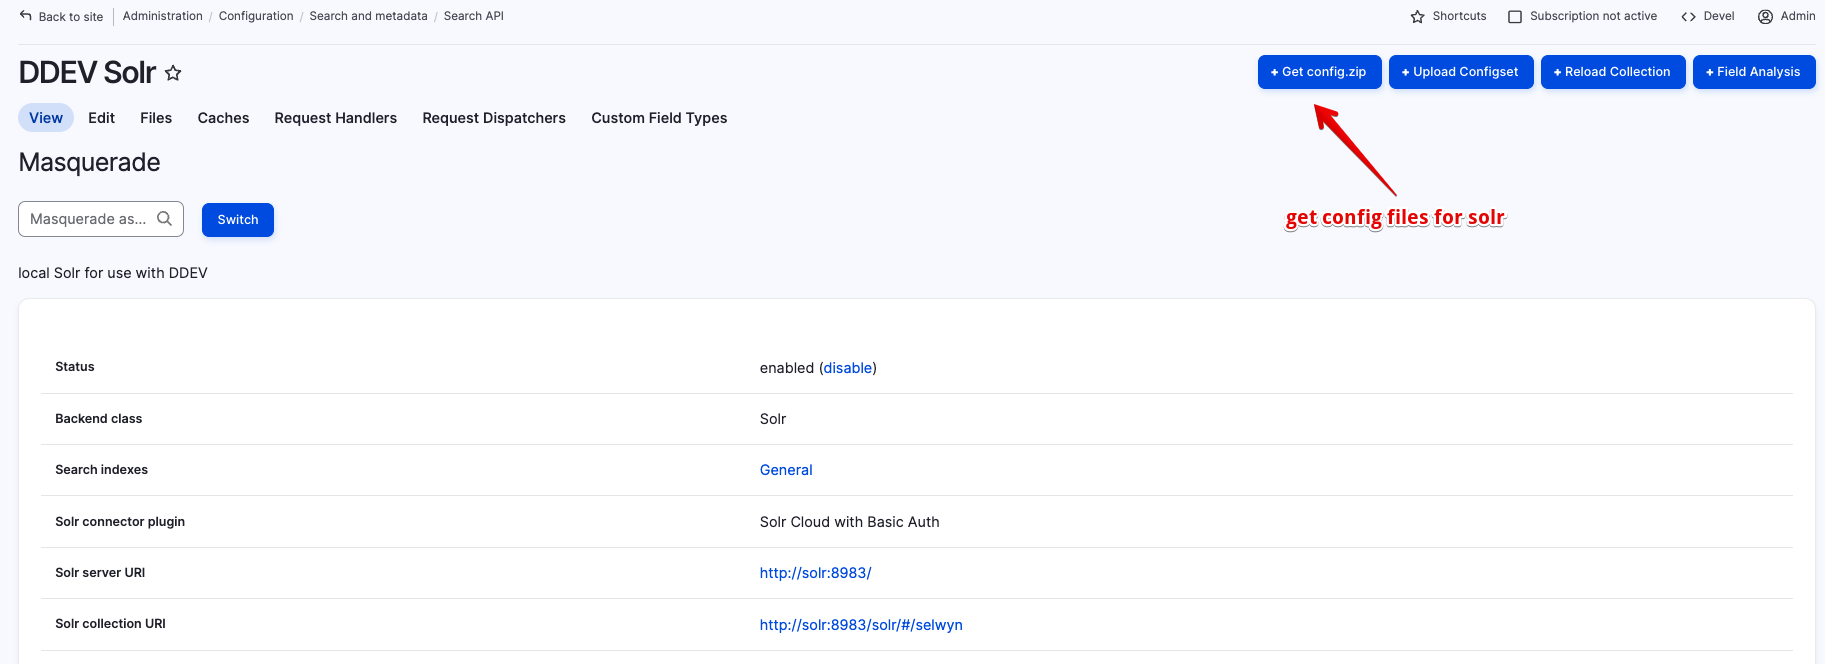
I copied the unzipped files into .ddev\solr\configsets\selwyn. These were my files:
accents_en.txt                   protwords_en.txt                 schema_extra_fields.xml          solrconfig_extra.xml             solrconfig_requestdispatcher.xml stopwords_und.txt
accents_und.txt                  protwords_und.txt                schema_extra_types.xml           solrconfig_index.xml             solrcore.properties              synonyms_en.txt
elevate.xml                      schema.xml                       solrconfig.xml                   solrconfig_query.xml             stopwords_en.txt                 synonyms_und.txt
Restarting ddev with ddev restart will make the new schema available to the solr server.
It seems like if you use a different directory name to copy the unzipped config.zip file i.e. use fred instead of selwyn DDEV will create a collection called fred. In the Solr, ui, you should be able to see the collection name in the left-hand column.
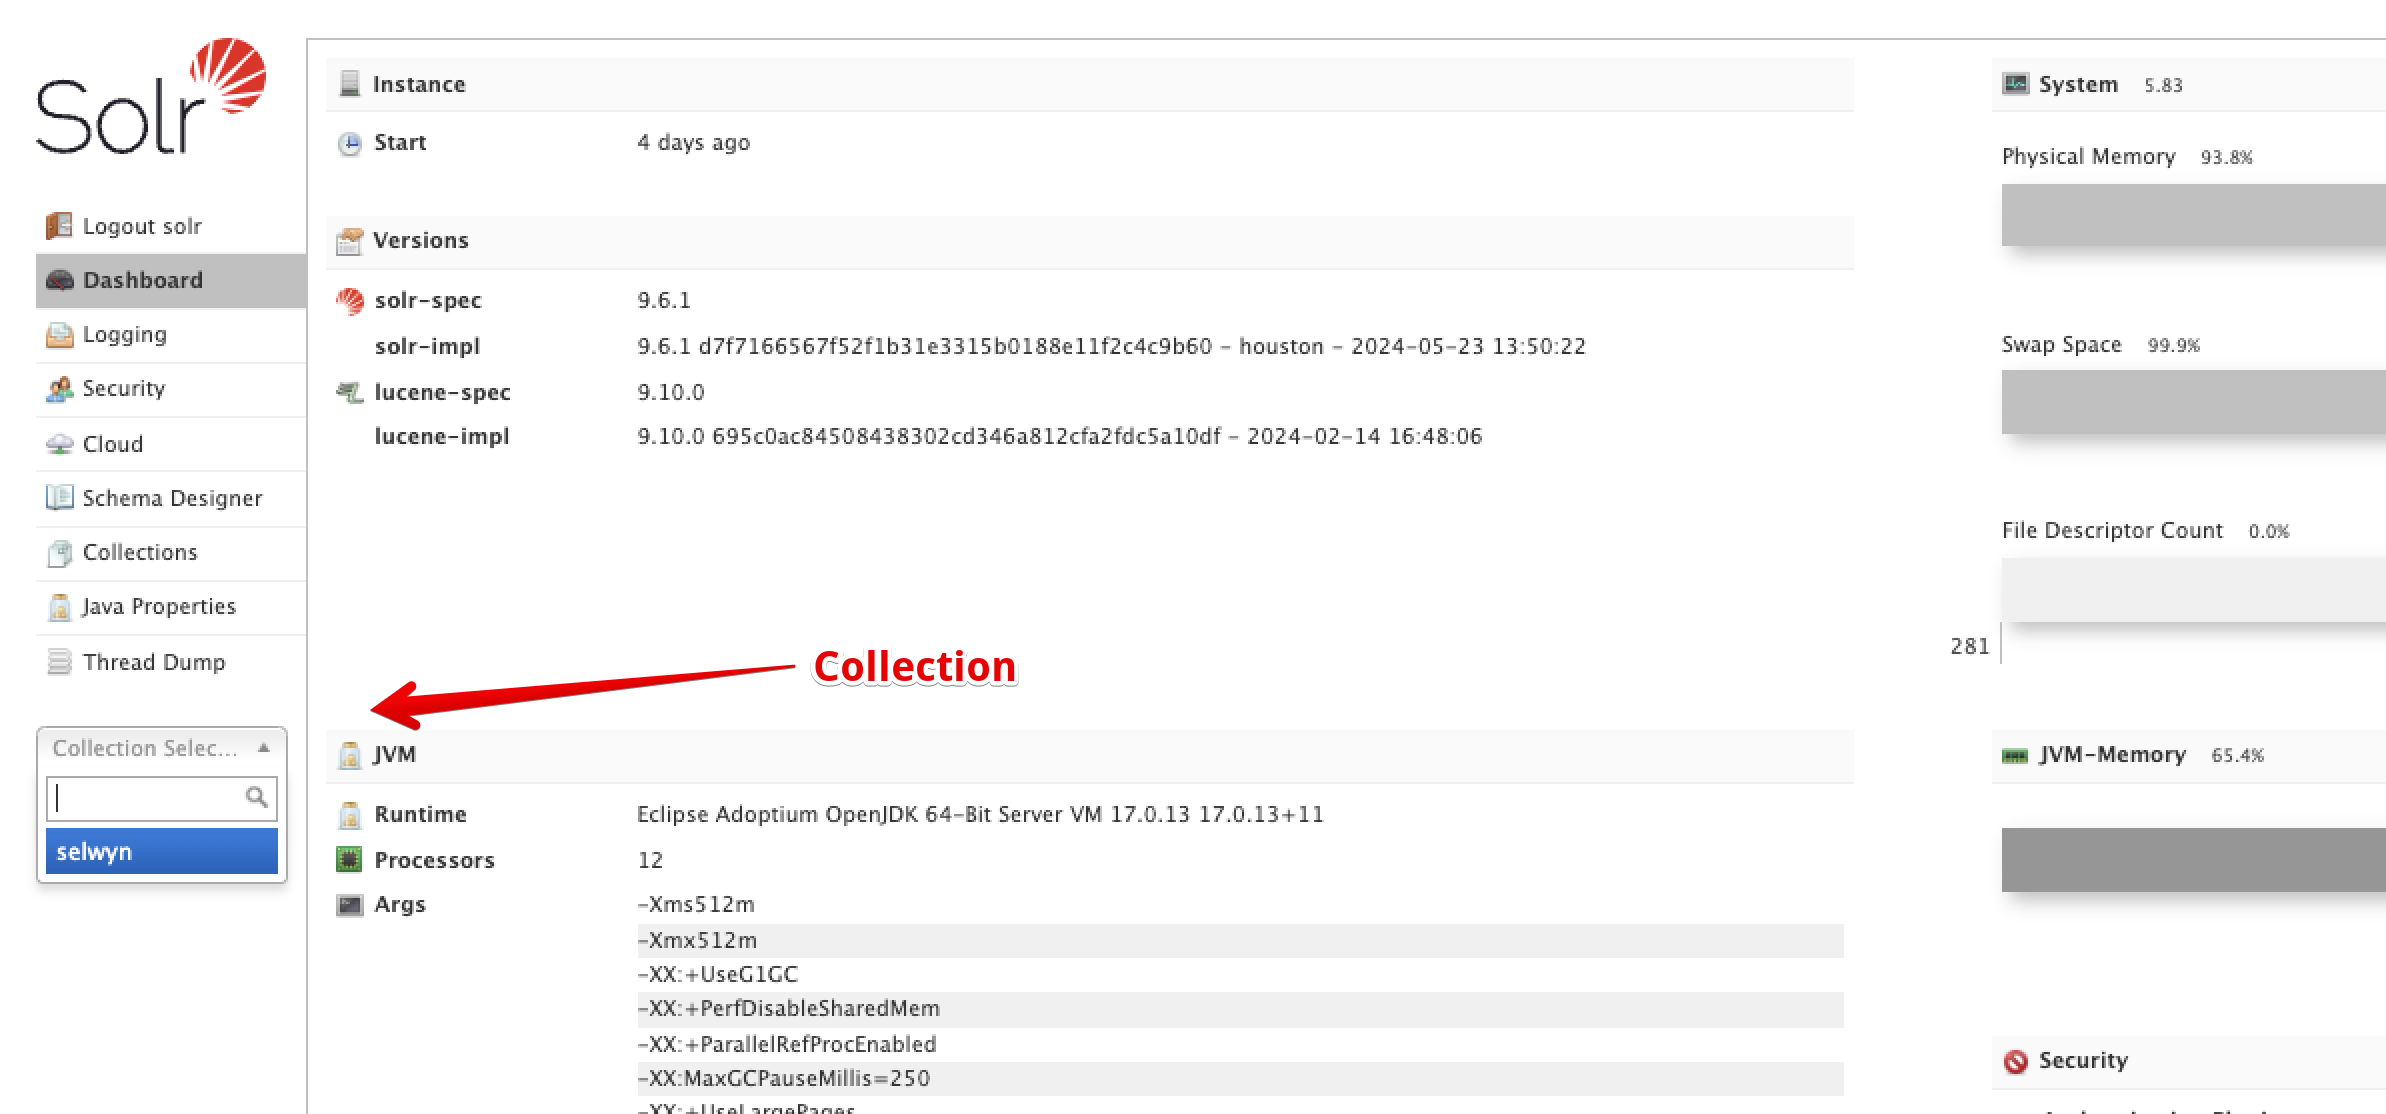
Also 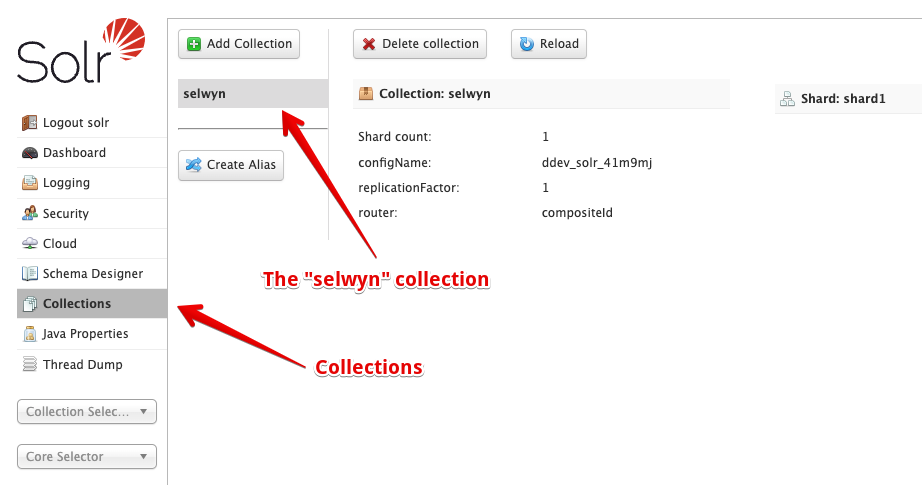
More at Search API Solr module README
Delete the Solr collection
You can delete the collection at any time using the Delete collection button in the Solr u.i. This will remove the collection from the Solr server. You can easily put it back by using the +Upload Configset button on the server page as outlined above. At this time (Nov 2024) the delete collection from the (Search API) view server page doesn't work.
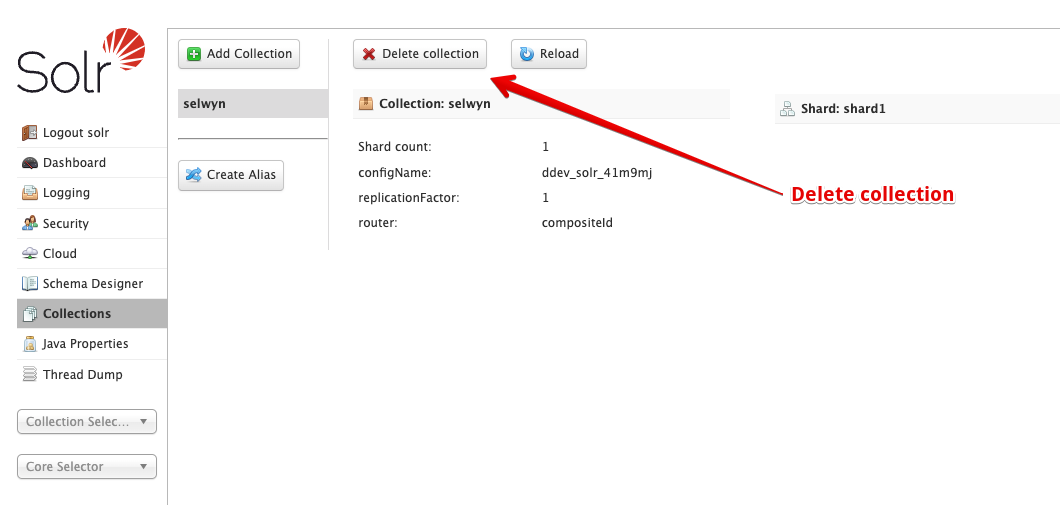
Query the Solr server
You can query the Solr server directly the Solr u.i. This will show you the raw data in the Solr server.
Select the collections, then the selwyncollection in the left column. Using all defaults, click theExecute Query` button and you'll see a list of JSON documents.
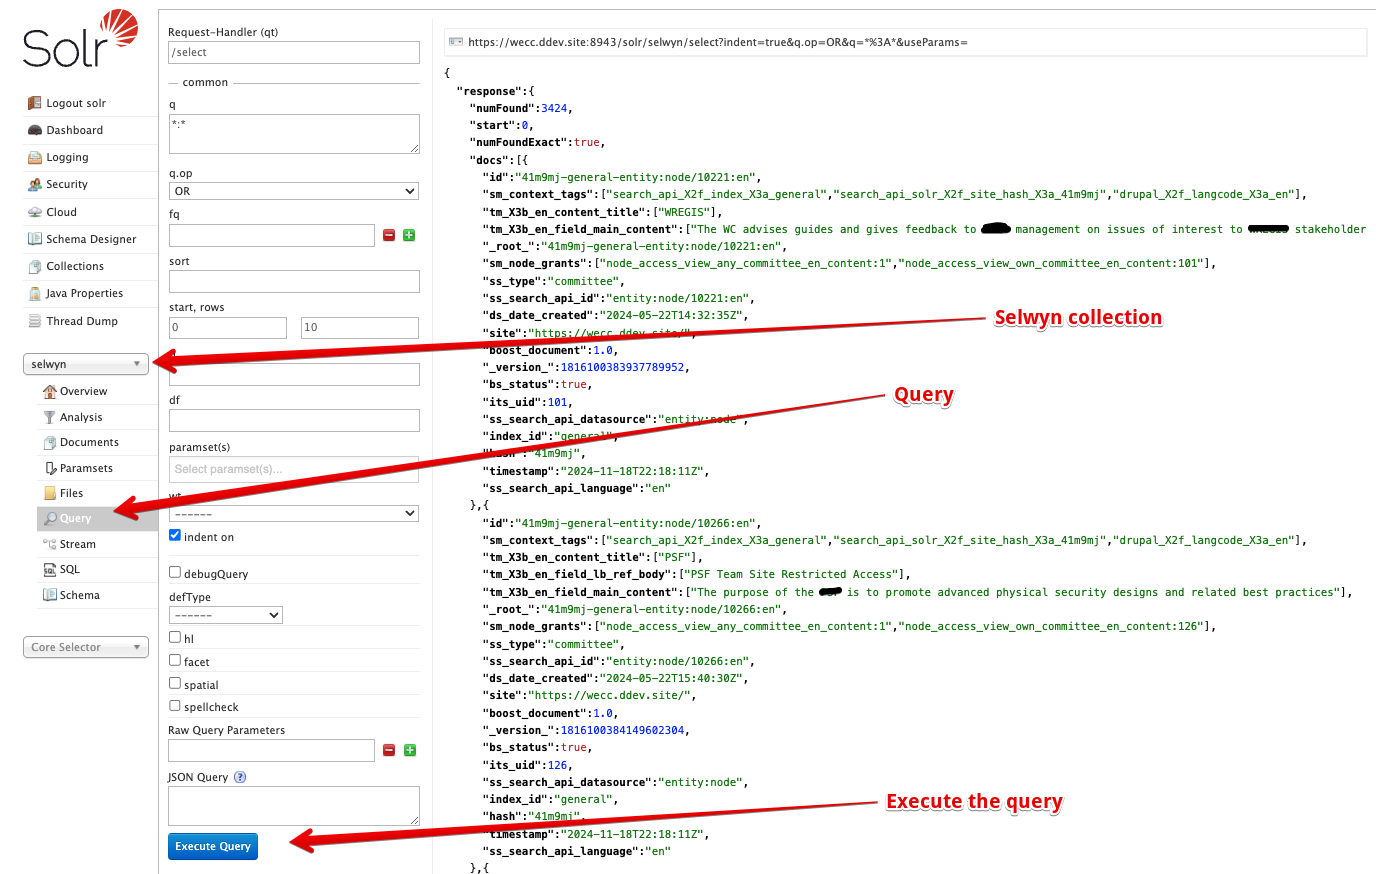
Add a Search API index
At /admin/config/search/search-api click on the "Add index" button.
Specify Content as the data source and the Bundles (content types) that you want indexed.
Specify the languages. For the server, specify the server you created above. In our example, it is ddev.
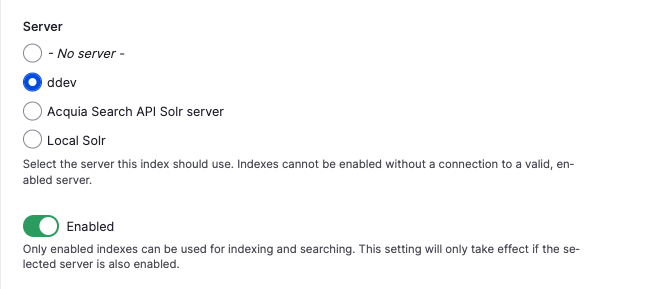
Enable the index
Here are some suggestions for the index options
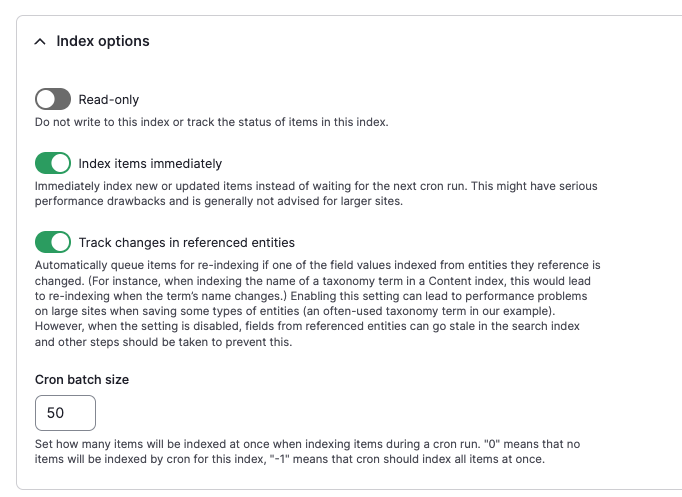
Save the index.
In the view index page, you can index the content by clicking the Index now button. If it is grayed out, first use the clear all indexed data button.
Your search index should now be ready to use.
More at Search API Solr module README
PHPStorm and Drupal
Read all about PHPStorm's support for Drupal. This covers:
- Associating Drupal-specific files with the PHP file type
- Using Drupal hooks in PhpStorm
- Setting up Drupal code style in a PhpStorm project
- Checking code against the Drupal coding standards
- Viewing the Drupal API documentation from PhpStorm
- Using the Drush command line tool from PhpStorm
- Using Drupal 8 with Symfony
Read about setting up PHPStorm and Drupal on drupal.org - updated August 2023
PHPStorm and Xdebug
Debugging drush commands at https://www.jetbrains.com/help/phpstorm/drupal-support.html#debugging-drush-commands
PHPStorm has a series of instructions for configuring PHPStorm with Xdebug, but unfortunately, nothing specifically on using it with DDEV. Fortunately, it doesn't require any special setup for it to work.
Some settings I use
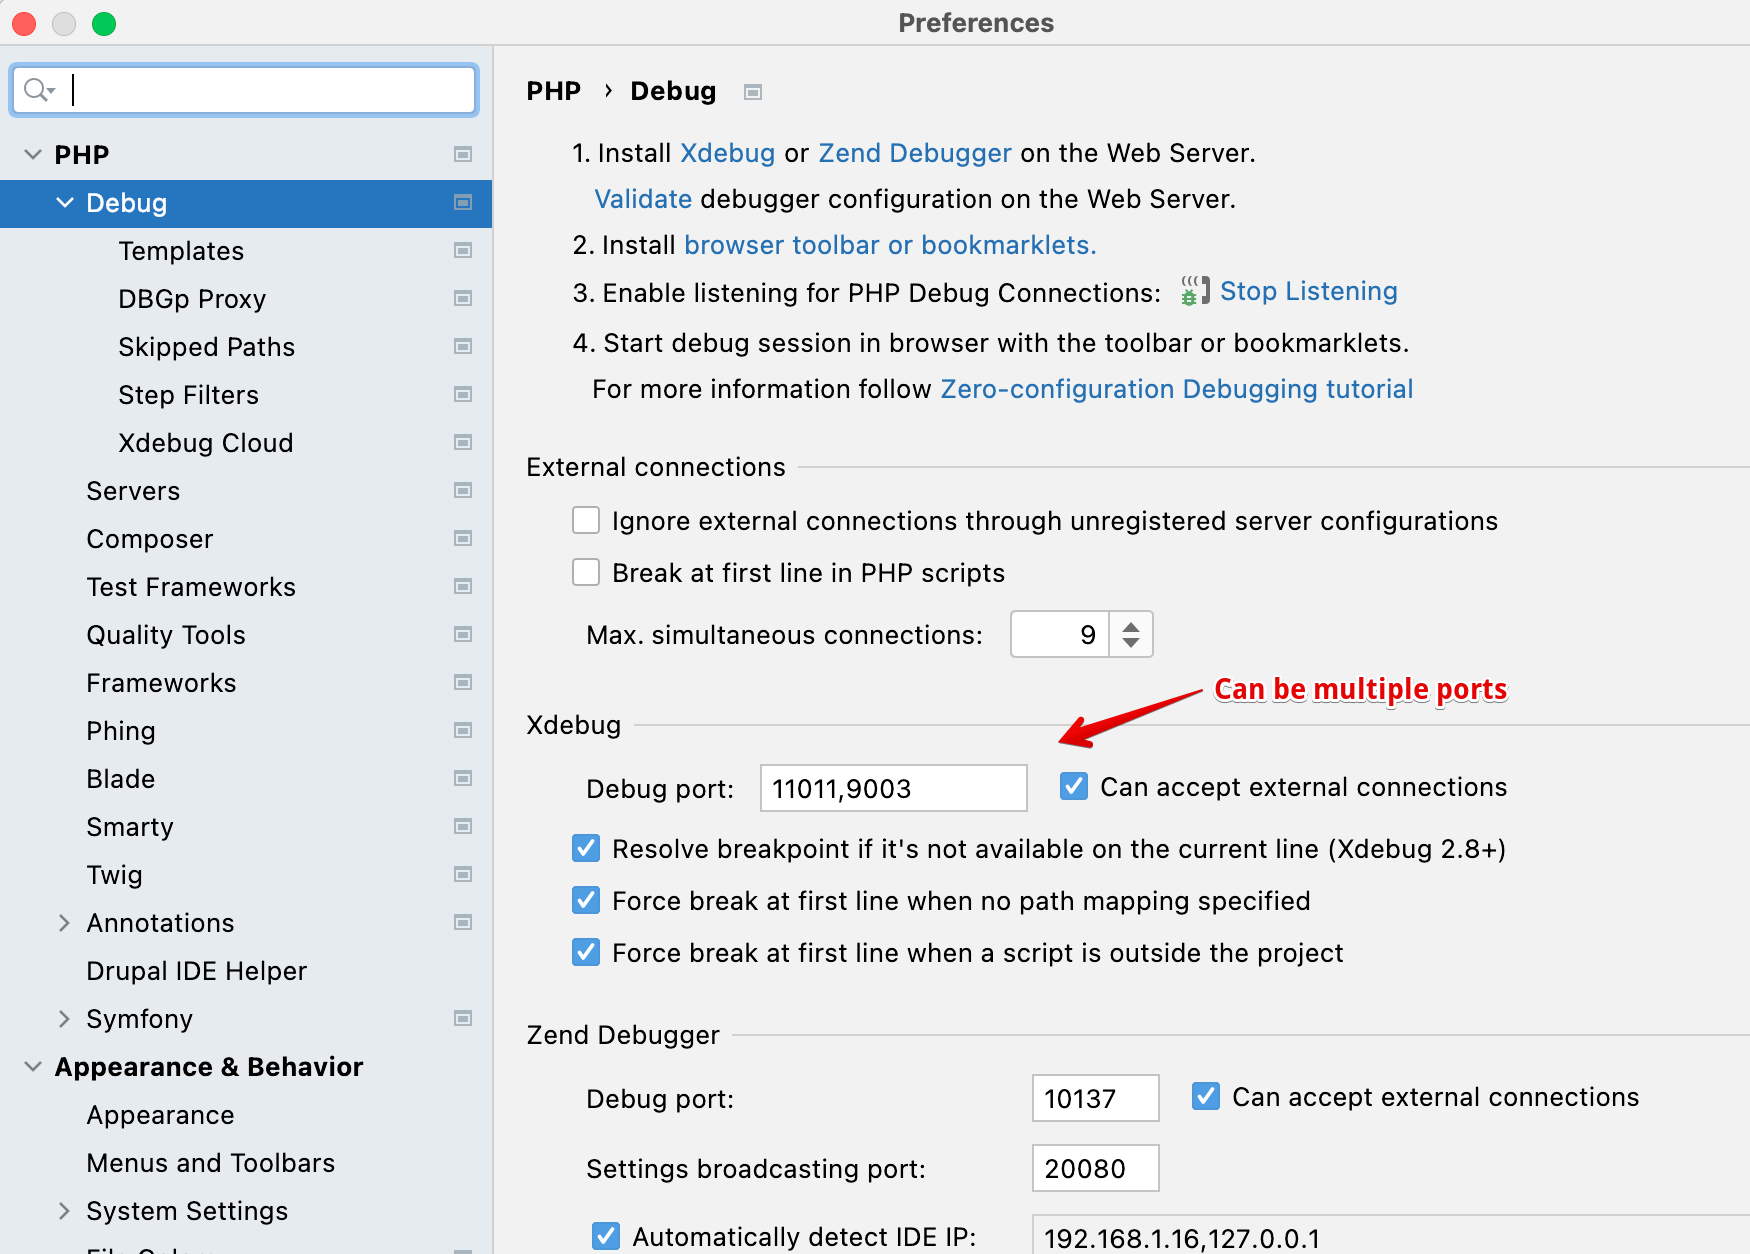
And for this project
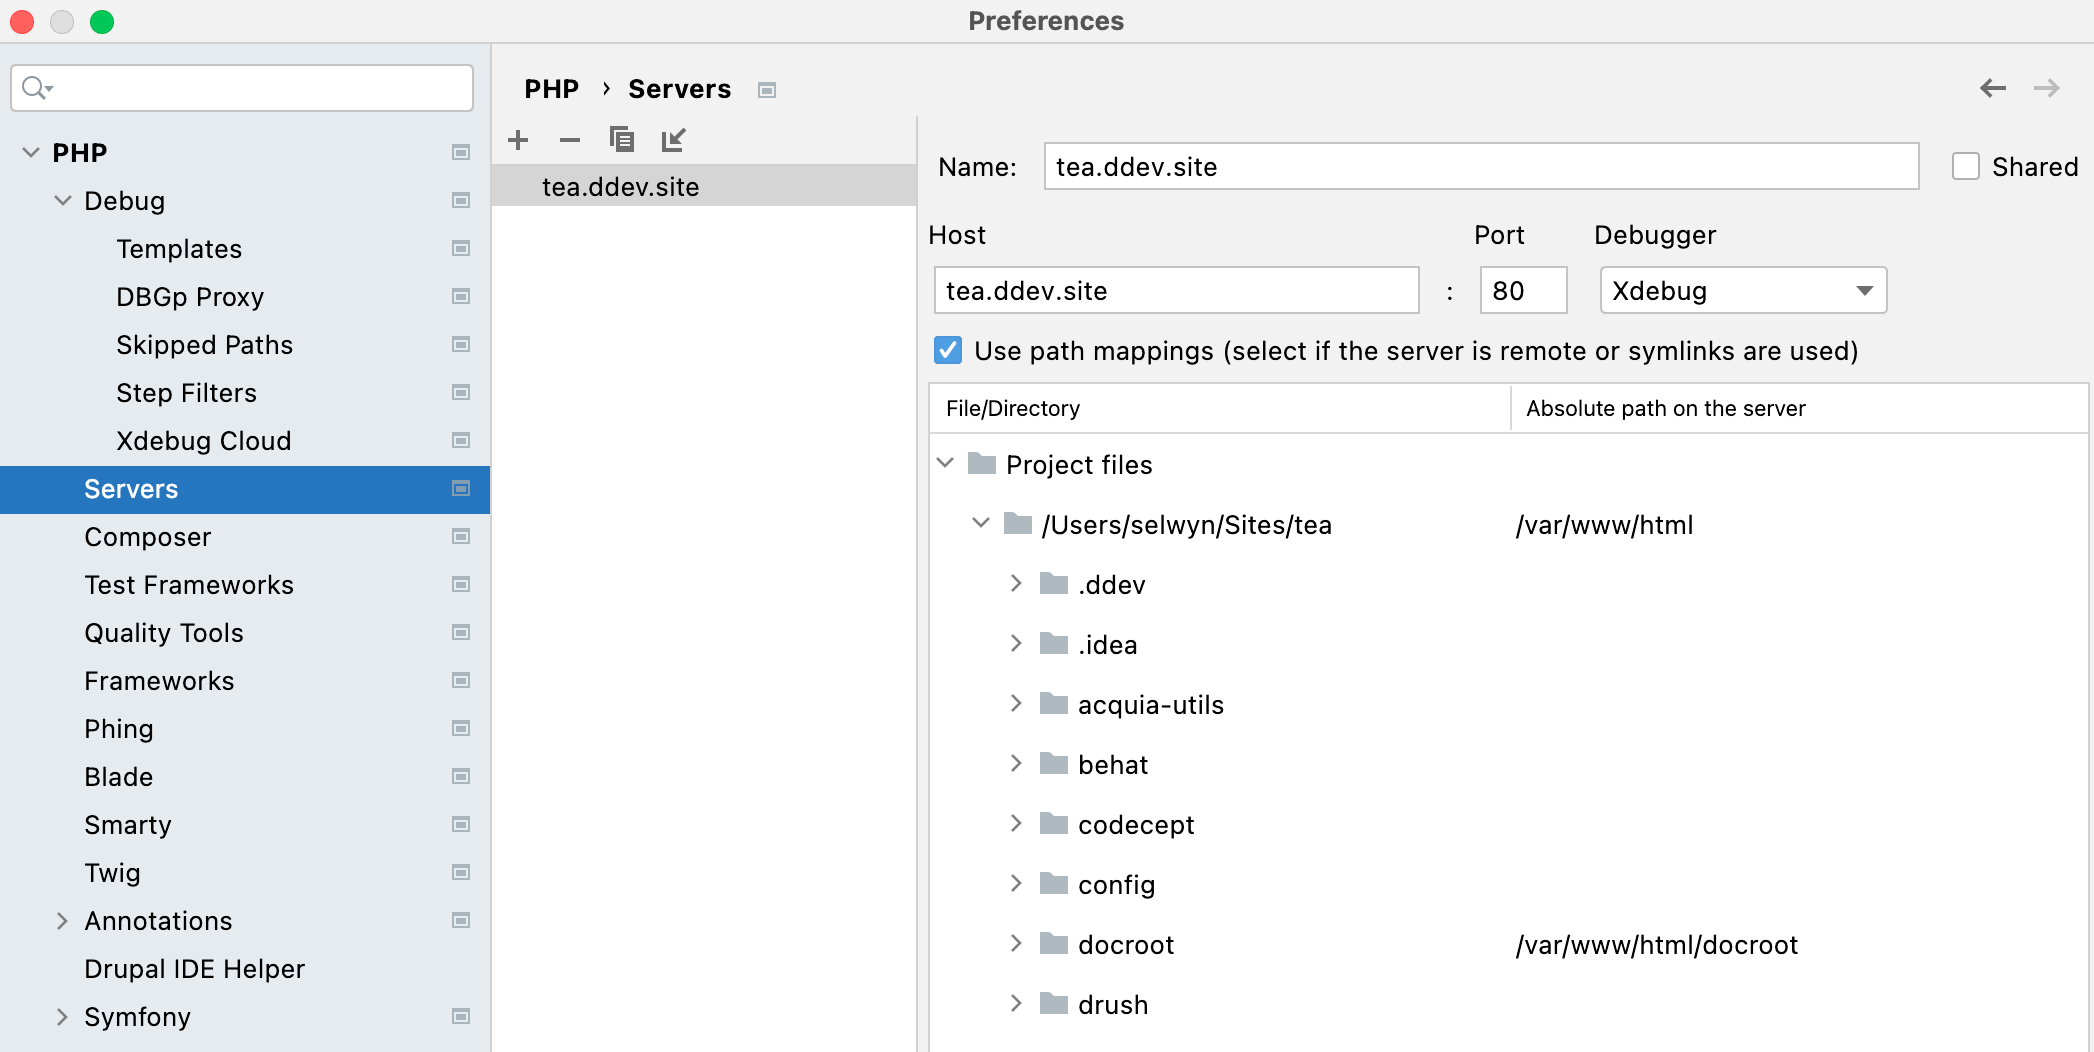
If PhpStorm doesn't stop when you set a breakpoint on some code, try deleting the server from the config debug, php, servers.
Make sure PHPStorm is listening by clicking the listen button

When you try again, it will be recreated, but you will probably need to specify the path (from the image above).
For Lando, check out: How to configure xdebug with Lando & VS code for Drupal Development - Apr 2023 also Lando + PHPStorm + Xdebug in the Lando docs - Updated Nov 2023
add a breakpoint in code
You can click on the line number or add the following in code:
xdebug_break()Collecting PhpStorm debugging logs
In the Settings/Preferences dialog (⌘ ,) , go to PHP.
From the PHP executable list, choose the relevant PHP interpreter and click next to it. In the CLI Interpreters dialog that opens, click the Open in Editor link next to the Configuration file: <path to php.ini> file. Close all the dialogs and switch to the tab where the php.ini file is opened.
In the php.ini, enable Xdebug logging by adding the following line:
For Xdebug 3xdebug.log="path_to_log/xdebug.log"The log file contains the raw communication between PhpStorm and Xdebug as well as any warnings or errors:
Xdebug in twig
When you need to see the values of variables in your twig templates, simply enable Xdebug and add the following line to your twig template:
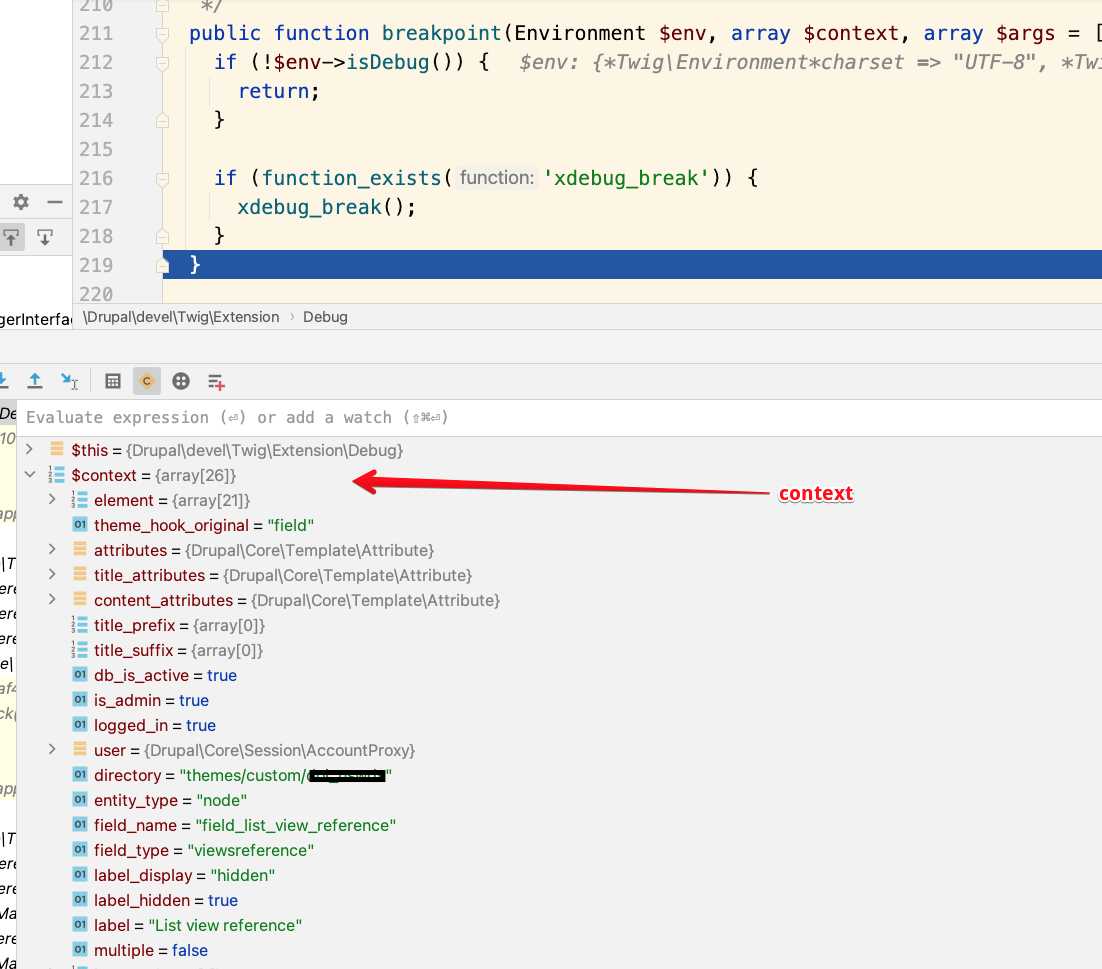
{{ devel_breakpoint() }}This will cause xdebug to stop in docroot/modules/contrib/devel/src/Twig/Extension/Debug.php at the breakpoint() function. You can then easily look in the $context variable which holds everything that is available in the twig template.
PHPStorm has the ability to step through twig templates just like PHP code. (I haven't tried this yet.) See this Jetbrains blog post on Twig debug support for details. There is also a Twig Xdebug contrib module.
Code Sniffing with phpcs
You can set up PhpStorm to automatically look at your code and warn you of lines that do not meet Drupal Coding Standards.
Best practice is to install the Drupal dev tools (with composer require --dev drupal/core-dev) which include the coder module. See How to implement Drupal Coding standards at drupalize.me for details on how to install and configure it.
Go to: Settings, PHP, Quality Tools, PHP_CodeSniffer
Use the following settings:
- ON
- Configuration: System PHP
- Check files with extensions: php, js, css, inc, module
- Check the Installed standards path option and set that to the path to the coder module in your project. e.g.
/Users/spolit/Sites/tea/vendor/drupal/coder/coder_sniffer. You may have to do this twice. - Coding standard: Drupal. Note, this may not be an option at this time so follow the next steps below and come back to this.
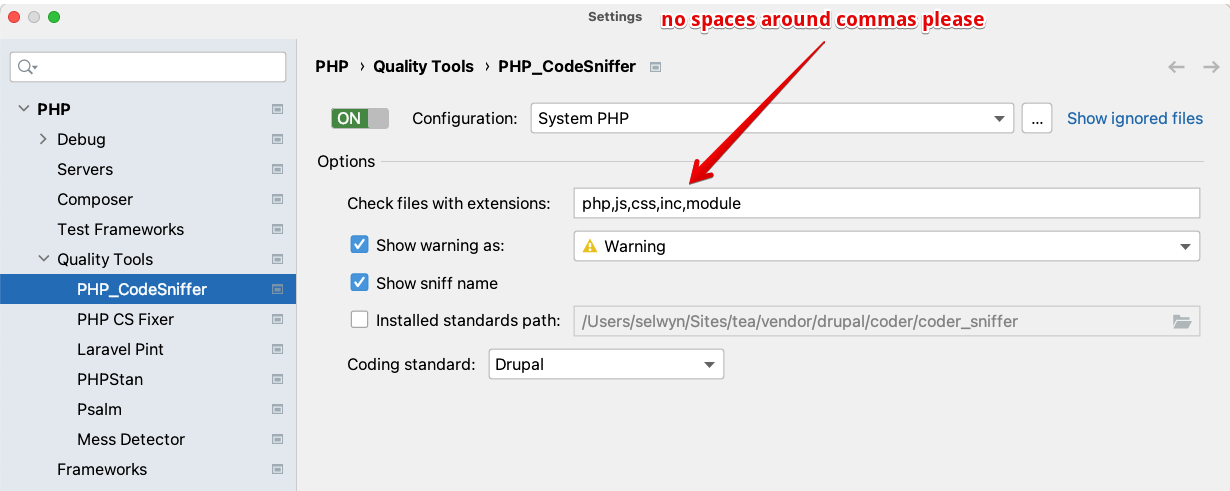
Click the ... button on this page. This will display the PHP_CodeSniffer dialog. Set the PHP_CodeSniffer path to :/Users/spolit/Sites/tea/vendor/bin/phpcs if you have the core-dev tools installed in your project. At this time you can also set the Path to phpcbf to /Users/spolit/Sites/tea/vendor/bin/phpcbf if you want to use the code beautifier and fixer.
Note
Replace /Users/spolit/Sites/tea with the path to your project.
Use /Users/spolit/.composer/vendor/bin/phpcs and /Users/spolit/.composer/vendor/bin/phpcf respectively if you have installed phpcs globally.
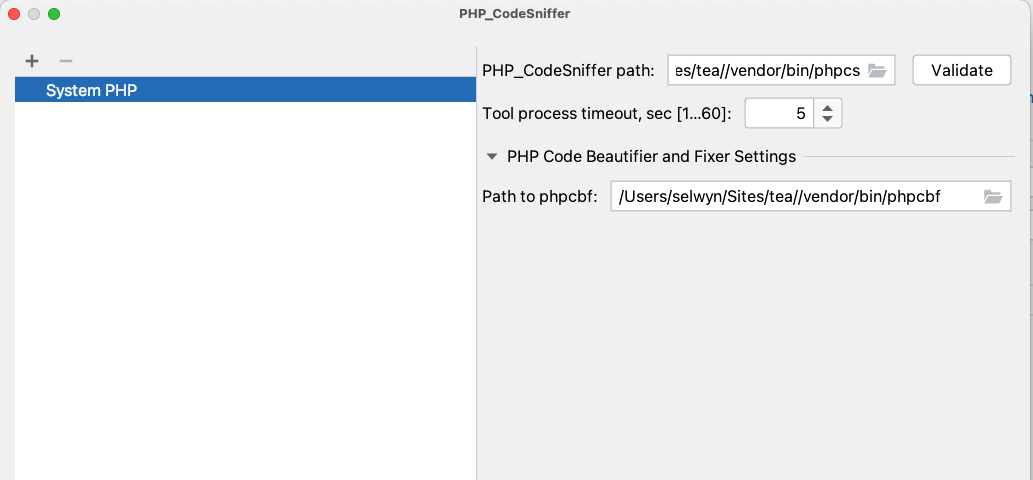
Next, you will need to click Apply and then OK. You can now run the code sniffer by right-clicking on a file or directory and selecting Run Inspection by PHP_CodeSniffer from the context menu.
If you are still not presented with the option to select the Drupal coding standard, click Apply and OK and then go back into the settings, PHP, Quality Tools, PHP_CodeSniffer and you should see the option to select the Drupal coding standard. (PHPStorm will kindly notify you that the list of coding standards has been updated.)
To test if it is working, edit a line of code and add a trailing space. That line of code should immediately get highlighted. Hovering over the line of code will show you "PHPCS: Whitespace found at end of line." If instead you see a dialog box that says "phpcs: ERROR: Referenced sniff "SlevomatCodingStandard.ControlStructures.RequireNullCoalesceOperator" does not exist then go back to the settings, PHP, Quality Tools, PHP_CodeSniffer and uncheck the installed standards path. Luckily, this still allows the Coding standard: Drupal to be selected. Now you should be able to edit a line, wait a moment and PHPStorm will highlight the line and you can see what Codesniffer is unhappy about.
More at
SlevoMat Coding Standards Error
If PhpStorm displays boxes complaining about:
phpcs: ERROR: Referenced sniff "SlevomatCodingStandard.ControlStructures.RequireNullCoalesceOperator" does not exist
Run "phpcs --help" for usage information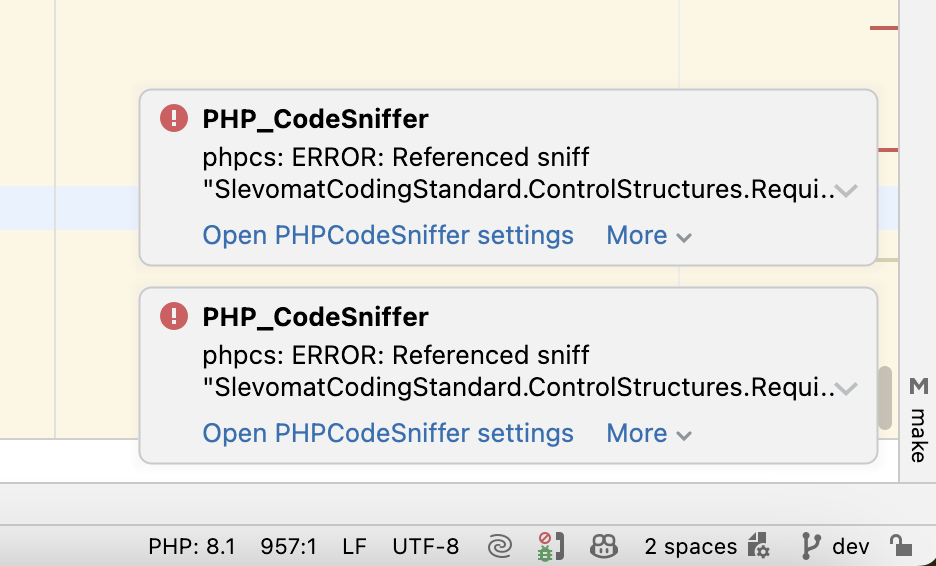
The solution is to open Settings, PHP, Quality Tools, PHP_CodeSniffer and uncheck the installed standards path. Luckily, this still allows the Coding standard: Drupal to be selected. Now you should be able to edit a line, wait a moment and PHPStorm will highlight the line and you can see what Codesniffer is unhappy about.
Lando Xdebug
In .lando.yml add xdebug: true:
services:
  appserver:
   xdebug: true
Run lando rebuild to restart the services with xdebug enabled. Please note, lando restart will not enable debug
Enable debugging in PHPStorm by clicking the telephone icon to select Start Listening for PHP Debug Connections.
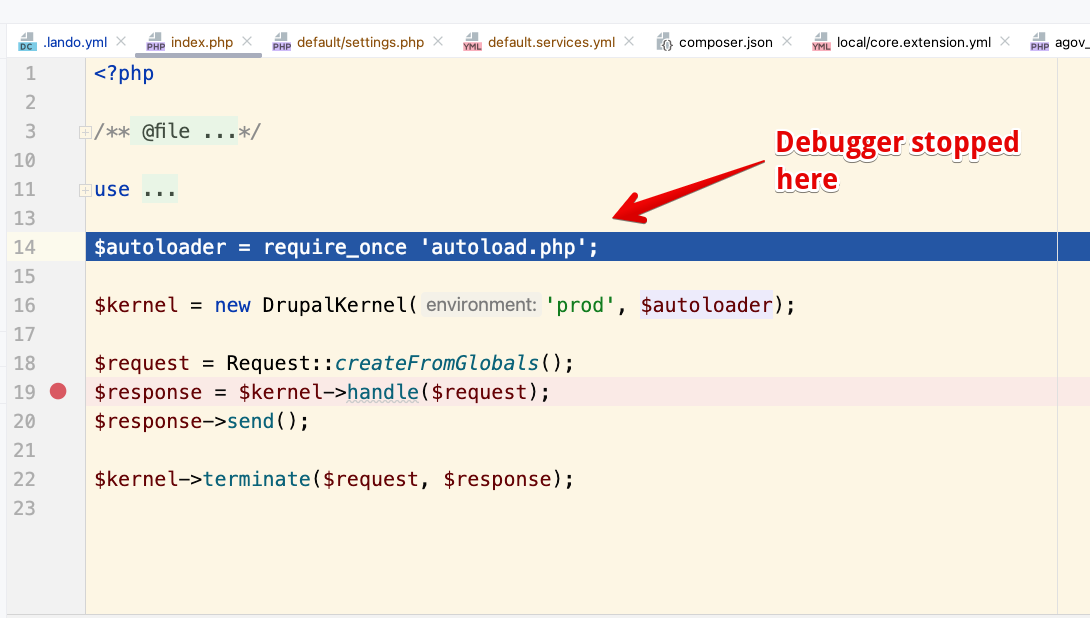
Open the index.php file and add a breakpoint by clicking on the line number.
Refresh the page with your site and you should see the PHPStorm open up the debug panel. Confusingly, it will focus on the Console tab.
Click on the Debugger tab where you will see the error message: Can't find a source position. Server with the name 'appserver' doesn't exist.
You will see:
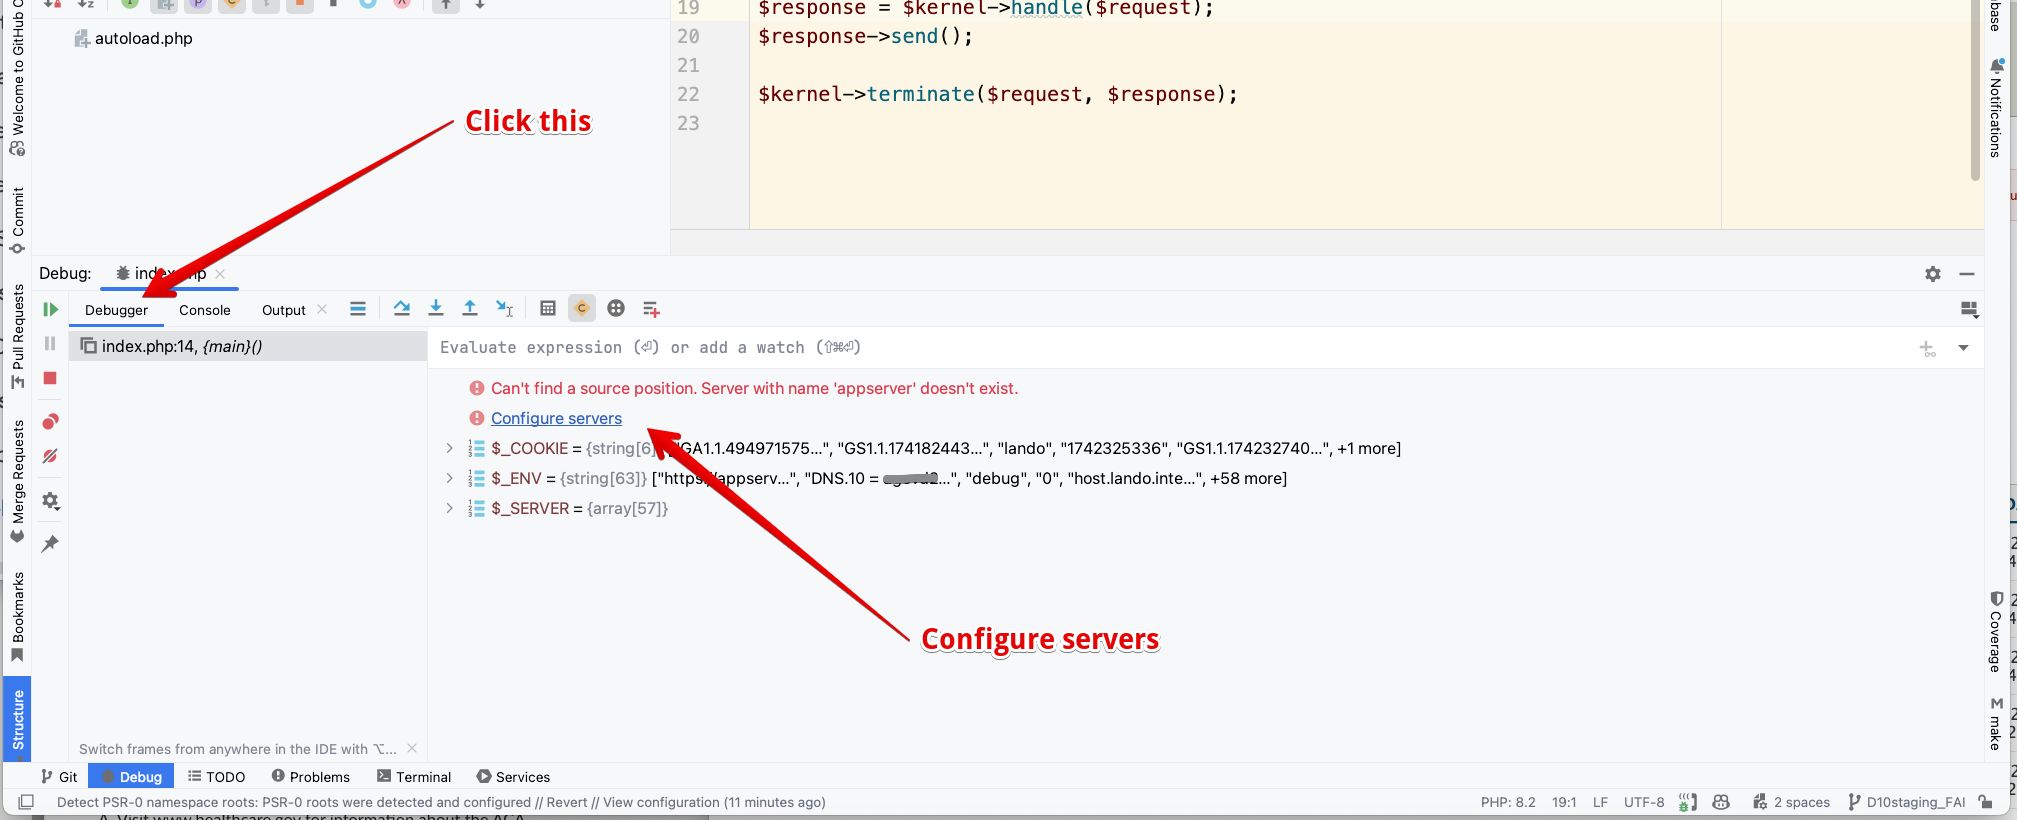
Click the link to Configure servers.
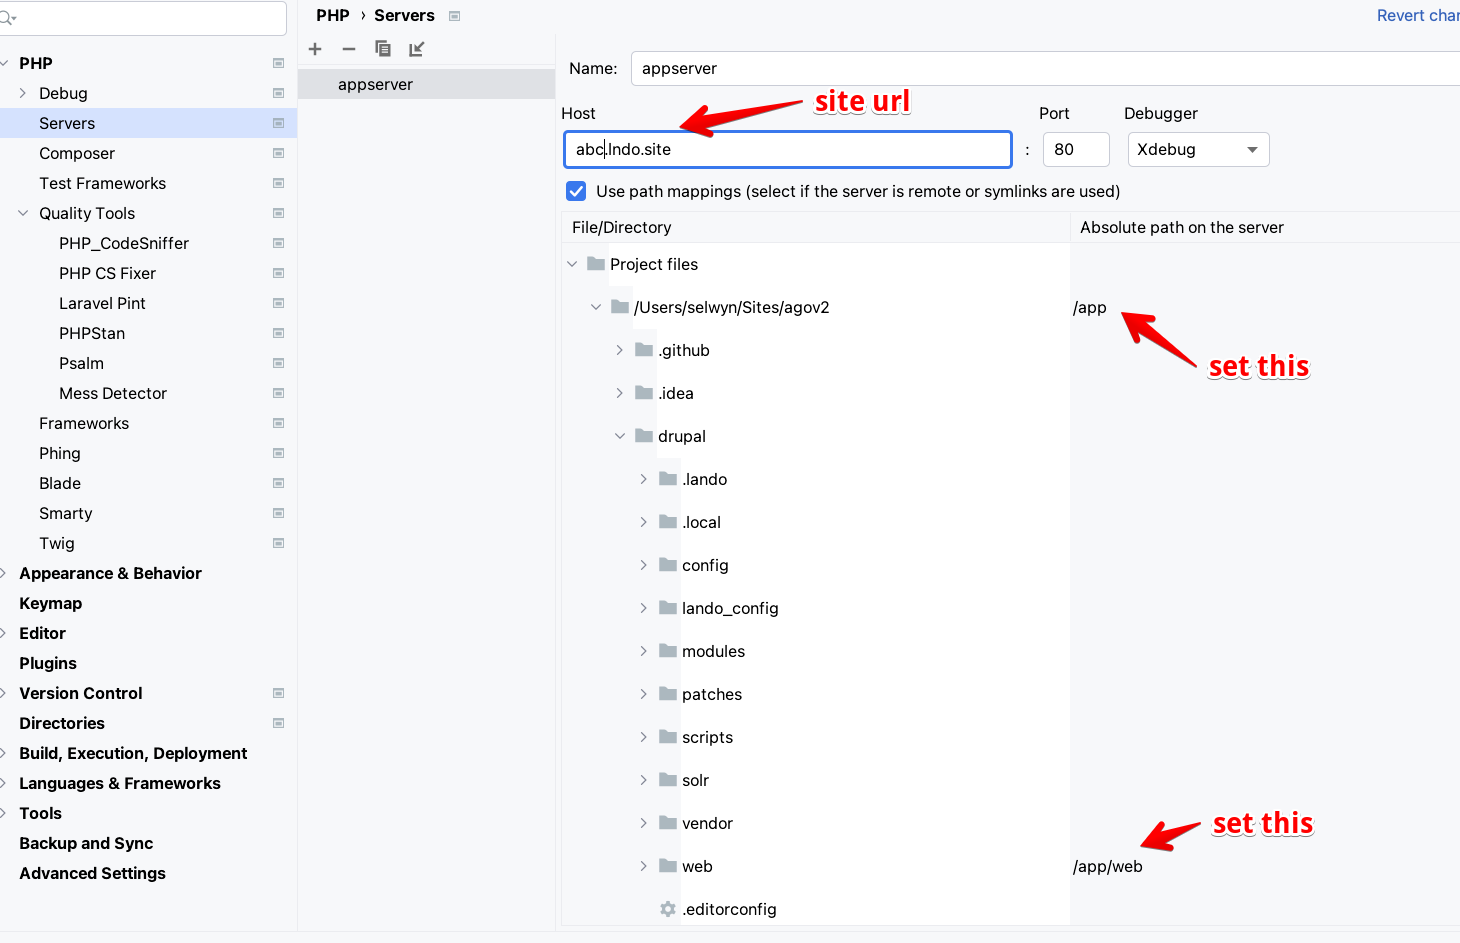
Add a server with the following settings:
- Name:
appserver(can be anything) - Host:
abc.lndo.site(this has to be the actual URL to the site without https://) - Port:
80 - Debugger:
Xdebug - Check the box for
Use path mappings - Under the
Absolute path on the servercolumn, set the top level of the site to/app - In addition, under the same column, set the web directory to
/app/web(Don't forget this step!)
As soon as you apply and click ok, the index.php file should appear with a blue line highlighting the breakpoint.
Additional info is available at Setting up Xdebug with Lando and PhpStorm on DrupalEasy.com - 2018
PHPStan static code analysis
Installing PHPStan
composer require --dev phpstan/phpstan phpstan/extension-installer mglaman/phpstan-drupal phpstan/phpstan-deprecation-rulesCreate a phpstan.neon in the root of the project. This one includes the editorUrl so you can click on links in the terminal to open PHPStorm at your line of code. It also includes a line to exclude the Unsafe usage message that is common in Drupal code. See Phil Norton's article Running PHPStan On Drupal Custom Modules - July 2022 for more.
parameters:
    level: 0
    paths:
        - web/modules/custom
    editorUrl: 'phpstorm://open?file=%%file%%&line=%%line%%'
    ignoreErrors:
        - '#Unsafe usage of new static\(\)#'
PHPStan has a number of levels that dictate what sort of things it will look for. Level 0, being the lowest level, looks for some basic checks like variables not being assigned and unknown classes being used. You can find the full description of the different levels on the PHPStan website:
- 0 - basic checks, unknown classes, unknown functions, unknown methods called on $this, wrong number of arguments passed to those methods and functions, always undefined variables
- 1 - possibly undefined variables, unknown magic methods and properties on classes with __call and __get
- 2 - unknown methods checked on all expressions (not just $this), validating PHPDocs
- 3 - return types, types assigned to properties
- 4 - basic dead code checking - always false instanceof and other type checks, dead else branches, unreachable code after return; etc.
- 5 - checking types of arguments passed to methods and functions
- 6 - report missing typehints
- 7 - report partially wrong union types - if you call a method that only exists on some types in a union type, level 7 starts to report that; other possibly incorrect situations
- 8 - report calling methods and accessing properties on nullable types
- 9 - be strict about the mixed type - the only allowed operation you can do with it is to pass it to another mixed
Running PHPStan
vendor/bin/phpstan analyze will run against any files in the paths specified in the phpstan.neon file.
You can override those with command line options like: vendor/bin/phpstan analyze --level 2 web/modules/custom/general/src/controller
You can also run it against a specific file like: vendor/bin/phpstan analyze --level 6 web/modules/custom/general/src/controller/GeneralController.php
Here is a sample of the output:
vendor/bin/phpstan analyze --level 6 web/modules/custom/general/src/controller/GeneralController.php
Note: Using configuration file /Users/selwyn/Sites/d9book2/phpstan.neon.
 1/1 [▓▓▓▓▓▓▓▓▓▓▓▓▓▓▓▓▓▓▓▓▓▓▓▓▓▓▓▓] 100%

 ------ -----------------------------------------------------------------------------------------------------------
  Line   GeneralController.php
 ------ -----------------------------------------------------------------------------------------------------------
  17     Method Drupal\general\Controller\GeneralController::build() has no return type specified.
         ✏️  GeneralController.php
  19     If condition is always false.
         ✏️  GeneralController.php
  25     Variable $path_alias in PHPDoc tag @var does not match assigned variable $my_node_alias.
         ✏️  GeneralController.php
  25     \Drupal calls should be avoided in classes, use dependency injection instead
         ✏️  GeneralController.php
  40     \Drupal calls should be avoided in classes, use dependency injection instead
         ✏️  GeneralController.php
  44     \Drupal calls should be avoided in classes, use dependency injection instead
         ✏️  GeneralController.php
  47     \Drupal calls should be avoided in classes, use dependency injection instead
         ✏️  GeneralController.php
If you run out of memory, try using a higher memory limit as documented at phpstan.org:
vendor/bin/phpstan.phar --memory-limit=256M or even vendor/bin/phpstan --memory-limit=1G
For more info:
- See Getting started with PHPStan on drupal.org updated October 2022
- Phil Norton's article Running PHPStan On Drupal Custom Modules - July 2022
- PHPStan documentation
- Watch Matt Glaman video from MidCamp 2024 - March 2024 and view the slides from the presentation
VS Code and Drupal
Some folks like to use Microsoft's Visual Studio Code (VS Code) as a free alternative to PHPStorm.
It has a number of plugins that can make it a powerful tool for Drupal development. Here are some of the plugins that you might find useful:
- PHP Intelephense - a high-performance PHP language server packed full of features.
- PHP Debug - a VS Code extension to enable debugging of PHP scripts.
- PHP CS Fixer - a PHP coding standards fixer for Visual Studio Code.
- PHP DocBlocker - a simple, dependency-free-PHP-specific DocBlocking package.
Check out some details of using VS Code with Drupal in the Drupal.org documentation - updated Feb 2025.
Mike Anello of Drupaleasy has a YouTube video from Midcamp explaining how to set up VS Code for Drupal Development - March 2024. The session description is:
Attendees of this session will leave with the knowledge necessary to configure their copy of Visual Studio Code as will be demonstrated in the session.
Learning objectives
Integrate phpcs, phpcbf, and PhpStan with Visual Studio Code Integrate Xdebug with Visual Studio Code Install and configure recommended Visual Studio Code extensions for Drupal development
Troubleshooting Xdebug with DDEV
- Use curl or a browser to create a web request. For example, curl https://d9.ddev.site
- If the IDE doesn't respond, take a look at ddev logs (
ddev logs). If you see a message like ""PHP message: Xdebug: [Step Debug] Could not connect to debugging client. Tried: host.docker.internal:9000 (through xdebug.client_host/xdebug.client_port)" then php/xdebug (inside the container) is not able to make a connection to port 9000. - In PhpStorm, disable the "listen for connections" button so it won't listen. Or just exit PhpStorm.
ddev sshinto the web container. Can you run telnet host.docker.internal 9000 and have it connect? If not, follow the instructions above about disabling firewall and adding an exception for port 9000.- In PhpStorm, disable the “listen for connections” button so it won’t listen. Or exit PhpStorm. With another IDE like VS Code, stop the debugger from listening.
ddev sshinto the web container. Can you runtelnet host.docker.internal 9000and have it connect? If so, you have something else running on port 9000. On the host, usesudo lsof -i :9000 -sTCP:LISTENto find out what’s there and stop it. Don’t continue debugging until your telnet command does not connect. (On Windows WSL2 you may have to look for listeners both inside WSL2 and on the Windows side.)- Now click the “listen” button on PhpStorm to start listening for connections.
ddev sshand try thetelnet host.docker.internal 9000again. It should connect. If not, maybe PhpStorm is not listening, or not configured to listen on port 9000?- Check to make sure that Xdebug is enabled. You can use
php -i | grep -i xdebuginside the container, or use any other technique you want that gives the output ofphpinfo(), including Drupal’sadmin/reports/status/php. You should see withXdebug v3andphp -i | grep xdebug.modeshould give youxdebug.mode => debug,develop => debug,develop. - Set a breakpoint in the first relevant line of your index.php and then visit the site in a browser. It should stop at that first line.
- If you’re using a flavor of IDE that connects directly into the web container like VS Code Language Server, you may want to use the global
xdebug_ide_locationsetting to explain to DDEV the situation. For example,ddev config global --xdebug-ide-location=container, which tells the PHP/Xdebug to connect directly to the listener inside the container. - To find out what DDEV is using for the value of
host.docker.internalyou can runDDEV_DEBUG=true ddev startand it will explain how it’s getting that value, which help troubleshoot some problems. You’ll see something likehost.docker.internal=192.168.5.2when running on Colima which can explain the usage.
For more, check out Troubleshooting Xdebug on DDEV docs
What is listening on port 9000?
To check if something is listening on port 9000 (the default port for xdebug) it's best to use lsof, although there are a few other options:
lsof -i TCP:9000Here is the output from lsof -i TCP:9000 where it reports that PhpStorm is listening:
COMMAND    PID   USER   FD   TYPE             DEVICE SIZE/OFF NODE NAME
phpstorm 24380 selwyn  525u  IPv6 0xb7fc31a42f1fb36d      0t0  TCP *:cslistener (LISTEN)
Here lsof -i TCP:9000 reports that php-fpm is listening.
COMMAND PID USER FD TYPE DEVICE SIZE/OFF NODE NAME

php-fpm 732 selwyn 7u IPv4 0x4120ed57a07e871f 0t0 TCP
localhost:cslistener (LISTEN)

php-fpm 764 selwyn 8u IPv4 0x4120ed57a07e871f 0t0 TCP
localhost:cslistener (LISTEN)

php-fpm 765 selwyn 8u IPv4 0x4120ed57a07e871f 0t0 TCP
localhost:cslistener (LISTEN)
You can also try netstat or nc both of which are slightly less informative:
Here is the output from netstat -an | grep 9000 indicating something is listening on port 9000:
tcp46 0 0 *.9000 *.* LISTENAnd from the nc -z localhost 9000 command showing something is listening on port 9000:
Connection to localhost port 9000 [tcp/cslistener] succeeded!Create your settings.local.php
1. Copy, rename, and move the sites/example.settings.local.php to sites/default/settings.local.php:
$ cp sites/example.settings.local.php sites/default/settings.local.php
2. Open sites/default/settings.php and uncomment these lines:
if (file_exists($app_root . '/' . $site_path . '/settings.local.php')) {
  include $app_root . '/' . $site_path . '/settings.local.php';
}
This will include the local settings file as part of Drupal's settings file.
3. Open settings.local.php and make sure development.services.yml is enabled.
$settings['container_yamls'][] = DRUPAL_ROOT . '/sites/development.services.yml';By default, development.services.yml contains the settings to disable Drupal caching:
services:
  cache.backend.null:
    class: Drupal\Core\Cache\NullBackendFactory
TIP
Do not create development.services.yml, it exists under /sites
4. In settings.local.php change the following to be TRUE if you want to work with enabled css- and js-aggregation:
$config['system.performance']['css']['preprocess'] = FALSE;
$config['system.performance']['js']['preprocess'] = FALSE;
5. Uncomment these lines in settings.local.php to disable the render cache and disable dynamic page cache:
$settings['cache']['bins']['render'] = 'cache.backend.null';
$settings['cache']['bins']['dynamic_page_cache'] = 'cache.backend.null';
Add the following lines to your sites/default/settings.local.php
$settings['cache']['bins']['page'] = 'cache.backend.null';If you do not want to install test modules and themes, set the following to FALSE:
$settings['extension_discovery_scan_tests'] = FALSE;6. Open sites/development.services.yml in the sites folder and add the following block to disable the twig cache and enable twig debugging:
parameters:
  twig.config:
    debug: true
    auto_reload: true
    cache: false
If the parameters section is already present in the development.services.yml file, append the twig.config section to it.
Note
The new way to enable Twig debugging is via the user interface. In the menus select Configuration, Development, Development Settings (or navigate to /admin/config/development/settings) and check the Twig development mode box, then check the boxes for Twig debug mode and disable Twig cache. You can also check the Do not cache markup at this time.
7. Rebuild the Drupal cache (ddev drush cr) otherwise, your website will encounter an unexpected error on page reload.
Refer to this article: Disable Drupal (>=8.0) caching during development on drupal.org - updated May 2023
Also, read https://www.drupaleasy.com/blogs/ultimike/2024/02/why-you-should-care-about-using-settingslocalphp
Development.services.yml
Recommended setup for development is to have this file in sites/development.services.yml. Confirm the location by looking in sites/default/settings.local.php for the following:
/**
 * Enable local development services.
 */
$settings['container_yamls'][] = DRUPAL_ROOT . '/sites/development.services.yml';
Here is the contents of the development.services.yml file:
# Local development services.
#
# To activate this feature, follow the instructions at the top of the
# 'example.settings.local.php' file, which sits next to this file.
parameters:
  http.response.debug_cacheability_headers: true
  twig.config:
    # Twig debugging:
    #
    # When debugging is enabled:
    # - The markup of each Twig template is surrounded by HTML comments that
    #   contain theming information, such as template file name suggestions.
    # - Note that this debugging markup will cause automated tests that directly
    #   check rendered HTML to fail. When running automated tests, 'debug'
    #   should be set to FALSE.
    # - The dump() function can be used in Twig templates to output information
    #   about template variables.
    # - Twig templates are automatically recompiled whenever the source code
    #   changes (see auto_reload below).
    #
    # For more information about debugging Twig templates, see
    # https://www.drupal.org/node/1906392.
    #
    # Not recommended in production environments
    # @default false
    debug: true
    # Twig auto-reload:
    #
    # Automatically recompile Twig templates whenever the source code changes.
    # If you don't provide a value for auto_reload, it will be determined
    # based on the value of debug.
    #
    # Not recommended in production environments
    # @default null
    # auto_reload: null
    auto_reload: true
    # Twig cache:
    #
    # By default, Twig templates will be compiled and stored in the filesystem
    # to increase performance. Disabling the Twig cache will recompile the
    # templates from source each time they are used. In most cases the
    # auto_reload setting above should be enabled rather than disabling the
    # Twig cache.
    #
    # Not recommended in production environments
    # @default true
    cache: false
services:
  cache.backend.null:
    class: Drupal\Core\Cache\NullBackendFactory
Make sure the following is in docroot/sites/default/settings.local.php.
/**
 * Enable local development services.
 */
$settings['container_yamls'][] = DRUPAL_ROOT . '/sites/development.services.yml';
Enable twig debugging output in source
Note
The new way to enable Twig debugging is via the user interface. In the menus select Configuration, Development, Development Settings (or navigate to /admin/config/development/settings) and check the Twig development mode box, then check the boxes for Twig debug mode and disable Twig cache. You can also check the Do not cache markup at this time.
In sites/default/development.services.yml set twig.config debug:true. See core.services.yml for lots of other items to change for development
# Local development services.
#
parameters:
  http.response.debug_cacheability_headers: true
  twig.config:
    debug: true
    auto_reload: true
    cache: false

# To disable caching, you need this and a few other items
services:
  cache.backend.null:
    class: Drupal\Core\Cache\NullBackendFactory
to enable put the following in settings.local.php:
/**
 * Enable local development services.
 */
$settings['container_yamls'][] = DRUPAL_ROOT . '/sites/development.services.yml';
You also need to disable the render cache in settings.local.php with:
$settings['cache']['bins']['render'] = 'cache.backend.null';Kint
Kint for PHP is a tool designed to present your debugging data in the absolutely best way possible. In other words, it’s var_dump() and debug_backtrace() on steroids. Easy to use, but powerful and customizable. An essential addition to your development toolbox.
Here is a detailed tutorial on how to print variables using Devel and Kint in Drupal - February 2022.
Setup
We need both the Devel and the Devel Kint Extras modules. Devel Kint Extras ships with the kint-php library which will be automatically installed if you install Devel Kint Extras using Composer:
$ composer require drupal/devel drupal/devel_kint_extrasEnable both with the following Drush command:
$ drush en devel_kint_extras -yFinally, enable Kint Extended as the Variables Dumper. To do this, go to admin/config/development/devel and select Kint Extender and Save the configuration.
Note
These plugins can cause out-of-memory errors. So, to make sure you don't run into these when using this module, make sure to add the following snippet to your settings.local.php:
if (class_exists('Kint')) {
  // Change the maximum depth to prevent out-of-memory errors for Kint ver 5.
  \Kint::$max_depth = 4;
}
In Kint 4 this setting was renamed, so if you're using that version use the following snippet:
if (class_exists('Kint')) {
  // Change the maximum depth to prevent out-of-memory errors for Kint ver 4.
  \Kint::$depth_limit= 4;
}
Add kint to a custom module
function custom_kint_preprocess_page(&$variables) {
  kint($variables['page']);
 }
Dump variables in a TWIG template
{{ kint(attributes) }}Kint::dump
From Migrate Devel contrib module, in /docroot/modules/contrib/migrate_devel/src/EventSubscriber/MigrationEventSubscriber.php.
This is used in migration to dump the source and destination values.
// We use kint directly here since we want to support variable naming.
kint_require();
\Kint::dump($Source, $Destination, $DestinationIDValues);
Set max levels to avoid running out of memory
This keeps your system from slowing down and running out of memory when using Kint.
Add this to settings.local.php
// Change kint maxLevels setting:
//include_once(DRUPAL_ROOT . '/modules/contrib/devel/kint/kint/Kint.class.php');
if (class_exists('Kint')) {
  // Change the maximum depth to prevent out-of-memory errors for Kint ver 5.
  \Kint::$max_depth = 4;
}
Replacing deprecated functions
If you need to find a deprecated function, you can search for it (in the keywords field) at the Change Records on drupal.org to find out how to replace it with a current function. For example, when searching for taxonomy_get_tree the site suggests:
 // Procedural code - for OO code, inject the TermStorage object.
  $tree = \Drupal::entityTypeManager()->getStorage('taxonomy_term')->loadTree($vid, $parent, $max_depth, $load_entities);
It also suggests:
TermStorageInterface::loadTree() now returns an array of all term objects in the tree. Each term object is extended to have "depth" and "parents" attributes in addition to its normal ones (aka the original return of taxonomy_get_tree()).
More on stackexchange
Missing module
If you see a PHP warning such as The following module is missing from the file system... (or similar) on your site, here are some ways to remove it:
A quick solution is to run drush cedit core.extension - you can then delete the line containing the unwanted module.
Note
Run drush cr first to try to get things sane. This opens the config in vim so you can use /tracer to search for tracer, dd to delete a line, :wq to save Also, if this fails, just try it again. Sometimes, it fails with a message like:
  The command "${VISUAL-${EDITOR-vi}} /tmp/drush_tmp_1711122194_65fda712e42d6/core.extension.yml" failed.
  Exit Code: 1(General error)
  Working directory: /Users/selwyn/Sites/ddev101/web

  Output:
  ================
  Error Output:
  ================
Also, check out Manually removing a missing module
If this doesn't work for you, try the following query:
$ drush sql-query "DELETE FROM key_value WHERE name='module_name';"More at How to fix "The following module is missing from the file system..." warning messages on Drupal.org
You have requested a non-existent service
Symfony\Component\DependencyInjection\Exception\ServiceNotFoundException: You have requested a non-existent service "lingotek.content_translation". in /var/www/vendor/symfony/dependency-injection/ContainerBuilder.php on line 1063 #0Sometimes, when drush cr throws errors like that try drush sqlc and then truncate cache_bootstrap and truncate cache_discovery.
Generating Test Content with Devel Generate
When building a Drupal website, it is useful to populate the site with enough content to check the overall display when using layouts, views and design. It becomes important to test the website out with dummy content before adding live content. Instead of manually typing or importing data, the Devel module allows you to create dummy content automatically.
More at:
- Working with the devel module in Drupal 9 to generate dummy content by Karishma Amin - August 2023
- Generating dummy Drupal content with Devel & more - October 2021
Enable verbose display of warning and error messages
In settings.local.php (or settings.php or settings.ddev.php) set the following config:
// Enable verbose logging for errors.
// https://www.drupal.org/forum/support/post-installation/2018-07-18/enable-drupal-8-backend-errorlogdebugging-mode
$config['system.logging']['error_level'] = 'verbose';
The options are:
hide: No errors or warningssome: Errors and warningsall: All messagesverbose: All messages, with backtrace information
See Enable verbose error logging for better backtracing and debugging - Updated April 2023
Testing a local API from Drupal and DDEV
When you to have Drupal communicate with an external API, you might want to to test the API locally. To do this, you can use curl or a browser to make calls to your endpoint e.g. http://localhost:3000/api/v1/crms/external/protocol/find/all.
Using a tool such as Mocktoon you can set up a local endpoint which Drupal can communicate with. Mockoon is a free and open-source desktop application allowing to quickly mock servers and APIs. Testing against the local API with curl looks like:
curl -w "\nHTTP Status: %{http_code}\n" http://localhost:3000/api/v1/crms/external/protocol/find/all

{
"userId": "90554",
"firstname": "Clovis",
"lastname": "Lemke",
"friends": [
    {
      "id": "e56de95d-1f47-42f1-b79c-18a2fc0b3f93"
    },
    {
      "id": "1454f4a9-270f-4cb6-b88f-b6e7d9106daf"
    },
    {
      "id": "131eeffa-4194-41c7-9ef2-bddeb3872eb4"
    }
]
}
HTTP Status: 413
You can also put the URL in a browser to see the output. 
When you try to do this from Drupal, if you specify localhost:3000 Drupal will fail to connect. You might see errors like:
cURL error 7: Failed to connect to localhost port 3000 after 1 ms: Couldn't connect to server (see https://curl.haxx.se/libcurl/c/libcurl-errors.html) for http://localhost:3000/api/v1/crms/external/protocol/find/allThe solution is to rather specify the URL using host.docker.internal e.g. http://host.docker.internal:3000/api/v1/crms/external/protocol/find/all.
Enable CORS for testing
In some instances, you will need to enable CORS (Cross-Origin Resource Sharing) for various reasons including allowing your site to perform cross-domain ajax request in web applications.
Note
Remember that enabling wide-open CORS (allowing * for headers, methods, and origins) is generally insecure for production. You should restrict it to development environments, where security concerns are lower, and make sure that your CORS policy is locked down appropriately for production to prevent unauthorized or malicious access.
This is a two-step process involving a browser extension and a tweak to the sites/default/development.services.yml file.
Install a browser extension which allows you to make requests to the site from a different origin. There are many Chrome browser extensions that offer this. Tru Allow CORS: Access-Control-Allow-Origin. I like this version because it is easily configured, has a video tutorial, and has a testing page that lets you confirm that CORS is enabled. Once installed, you can click on the icon and enable CORS.
In
sites/default/development.services.ymladd the following:
parameters:
  ## Twig debug settings
  http.response.debug_cacheability_headers: true
  twig.config:
    debug: true
    auto_reload: true
    cache: false
  ## Enable CORS for testing
  cors.config:
    enabled: false
    # Specify allowed headers, like 'x-allowed-header'.
    allowedHeaders: ['*']
    # Specify allowed request methods, specify ['*'] to allow all possible ones.
    allowedMethods: ['*']
    # Configure requests allowed from specific origins.
    allowedOrigins: ['*']
    # Sets the Access-Control-Expose-Headers header.
    exposedHeaders: ['*']
    # Sets the Access-Control-Max-Age header.
    maxAge: 86400
    # Sets the Access-Control-Allow-Credentials header.
    supportsCredentials: true
Clear the Drupal cache and you should be ready to go.
Enabling CORS during Drupal development allows for smooth communication between a decoupled front-end and back-end, especially when they run on different origins (e.g., different ports or domains). It also facilitates testing integrations with third-party services, external APIs, mobile apps, and debugging potential CORS issues early, preventing problems when the app is deployed to production.
Module directory structure
From PSR-4 namespaces and autoloading in Drupal 8 on drupal.org - updated Dec 2022
Example vegetable.module directory structure:
- modules/vegetable/
- css/
- js/
- src/
- Controller/
- VegetableController.php → class Drupal\vegetable\Controller\VegetableController
- Controller/
- Form/
- VegetableForm.php → class Drupal\vegetable\Form\VegetableForm
- Plugin/
- Block/
- VegetableBlock.php → class Drupal\vegetable\Plugin\Block\VegetableBlock
- Entity/
- Tomato.php → class Drupal\vegetable\Entity\Tomato
- Cucumber.php → class Drupal\vegetable\Entity\Cucumber
- Tests/
- TomatoTest.php → class Drupal\vegetable\Tests\TomatoTest
- CucumberTest.php → class Drupal\vegetable\Tests\CucumberTest
- VegetableManagerTest.php → class Drupal\vegetable\Tests\VegetableManagerTest
- fixtures/
- weather-data.json
- templates/
- tests/
- src/
- Functional/
- Kernel/
- Unit/
- TomatoTest.php → class Drupal\Tests\vegetable\Unit\TomatoTest
- Traits/
- VegetableTestTrait.php → trait Drupal\Tests\vegetable\Traits\VetegableTestTrait
- src/
- vegetable.info.yml
- vegetable.routing.yml
- vegetable.module
Localstack - services
This is an alternative to DDEV where you need to use AWS services like S3, Solr, OpenSearch, dashboard locally. See localstack to see list of services available.
Add this to your docker-compose.yml
localstack:
  container_name: "${LOCALSTACK_DOCKER_NAME-localstack_main}"
  image: localstack/localstack:0.11.2
  ports:
    - "4566:4566"
    - "4571:4571"
    - "4578:4578"
    - "4598:4598"
    - "${LOCALSTACK_PORT_WEB_UI-9080}:${PORT_WEB_UI-9080}"
  environment:
    - EDGE_PORT=4566
    - SERVICES=${LOCALSTACK_SERVICES- }
    - DEBUG=${LOCALSTACK_DEBUG- }
    - DATA_DIR=${LOCALSTACK_DATA_DIR- }
    - PORT_WEB_UI=${LOCALSTACK_PORT_WEB_UI- }
    # - LAMBDA_EXECUTOR=${LOCALSTACK_LAMBDA_EXECUTOR- }
    - KINESIS_ERROR_PROBABILITY=${LOCALSTACK_KINESIS_ERROR_PROBABILITY- }
    - DOCKER_HOST=unix:///var/run/docker.sock
    - HOST_TMP_FOLDER=${LOCALSTACK_TMPDIR}
    - S3FS_BUCKET=${S3FS_BUCKET}
    # - ELASTICSEARCH__BACKEND=http://localhost:9200
    # - OPENSEARCH_CUSTOM_BACKEND=http://opensearch:9200
  volumes:
    - /tmp/localstack
    - "/var/run/docker.sock:/var/run/docker.sock"
    - ./aws/:/docker-entrypoint-initaws.d
To use the above localstack service specify the ports and endpoints you wish to use locally. The examples below are the defaults (no changes needed). I would change the s3 bucket name, everything else can be defaults.
# Localstack
# LOCALSTACK_SERVICES=s3,sns,sqs,es
# LOCALSTACK_SERVICES=opensearch
# LOCALSTACK_PORT_WEB_UI=9080
# LOCALSTACK_DATA_DIR=/tmp/localstack/data
# LOCALSTACK_TMPDIR=/tmp/localstack/tempdir

## Open Search
# OPENSEARCH_SERVICE_ENDPOINT=opensearch
# OPENSEARCH_PORT=9200
# OPENSEARCH_SERVICE_DOMAIN=
# LOCAL_OS_PROTOCOL=http://

# OPENSEARCH_USER=admin
# OPENSEARCH_PASSWORD=admin


# S3
# S3FS_BUCKET=your-bucket-name
# S3FS_REGION=us-west-2
# S3FS_HOSTNAME=localstack:4566
# S3FS_AWS_ACCESS_KEY=foo
# S3FS_AWS_SECRET_KEY=bar
# S3FS_USE_PATH_STYLE_ENDPOINT=TRUE
# S3FS_USE_HTTPS=FALSE
# S3FS_S3_PUBLIC_URL=http://localstack:4566/your-bucket-name
# S3FS_USE_CUSTOM_HOST=TRUE
Resources
- Composer best practices for Drupal 8 from Lullabot - Jan 2018
- Why DDEV by Randy Fay (Author of DDEV) - Dec 2022
- How to setup Devel and Kint on Drupal 9 by Alex - Aug 2021
- Enable verbose error logging for better backtracing and debugging - April 2023
- How to implement Drupal Coding standards at drupalize.me
- Running PHPStan On Drupal Custom Modules - July 2022
- The Ultimate Guide to drupal/core-* packages - May 2022
- DDEV performance especially around Mutagen on MacOS - Mar 2024
- DDEV CMS Quickstart guides - January 2024
- Why you should care about using settings.local.php - February 2024
- Troubleshooting Xdebug on DDEV docs
- Step debugging with Xdebug on DDEV docs
- Mix module for development
